CRWV 48-day bullish forecast — Nov 15, 2026
- Bias: Bullish
- Timeframe: 48 days (made Nov 15, 2026, target date Jan 1, 2027)
- Price at analysis: $53.13
- Price target: $56.50
- Expected range: $50.50 – $60.00
- Result: Pending — graded after the close on Jan 1, 2027
Get a free AI analysis of CRWV today
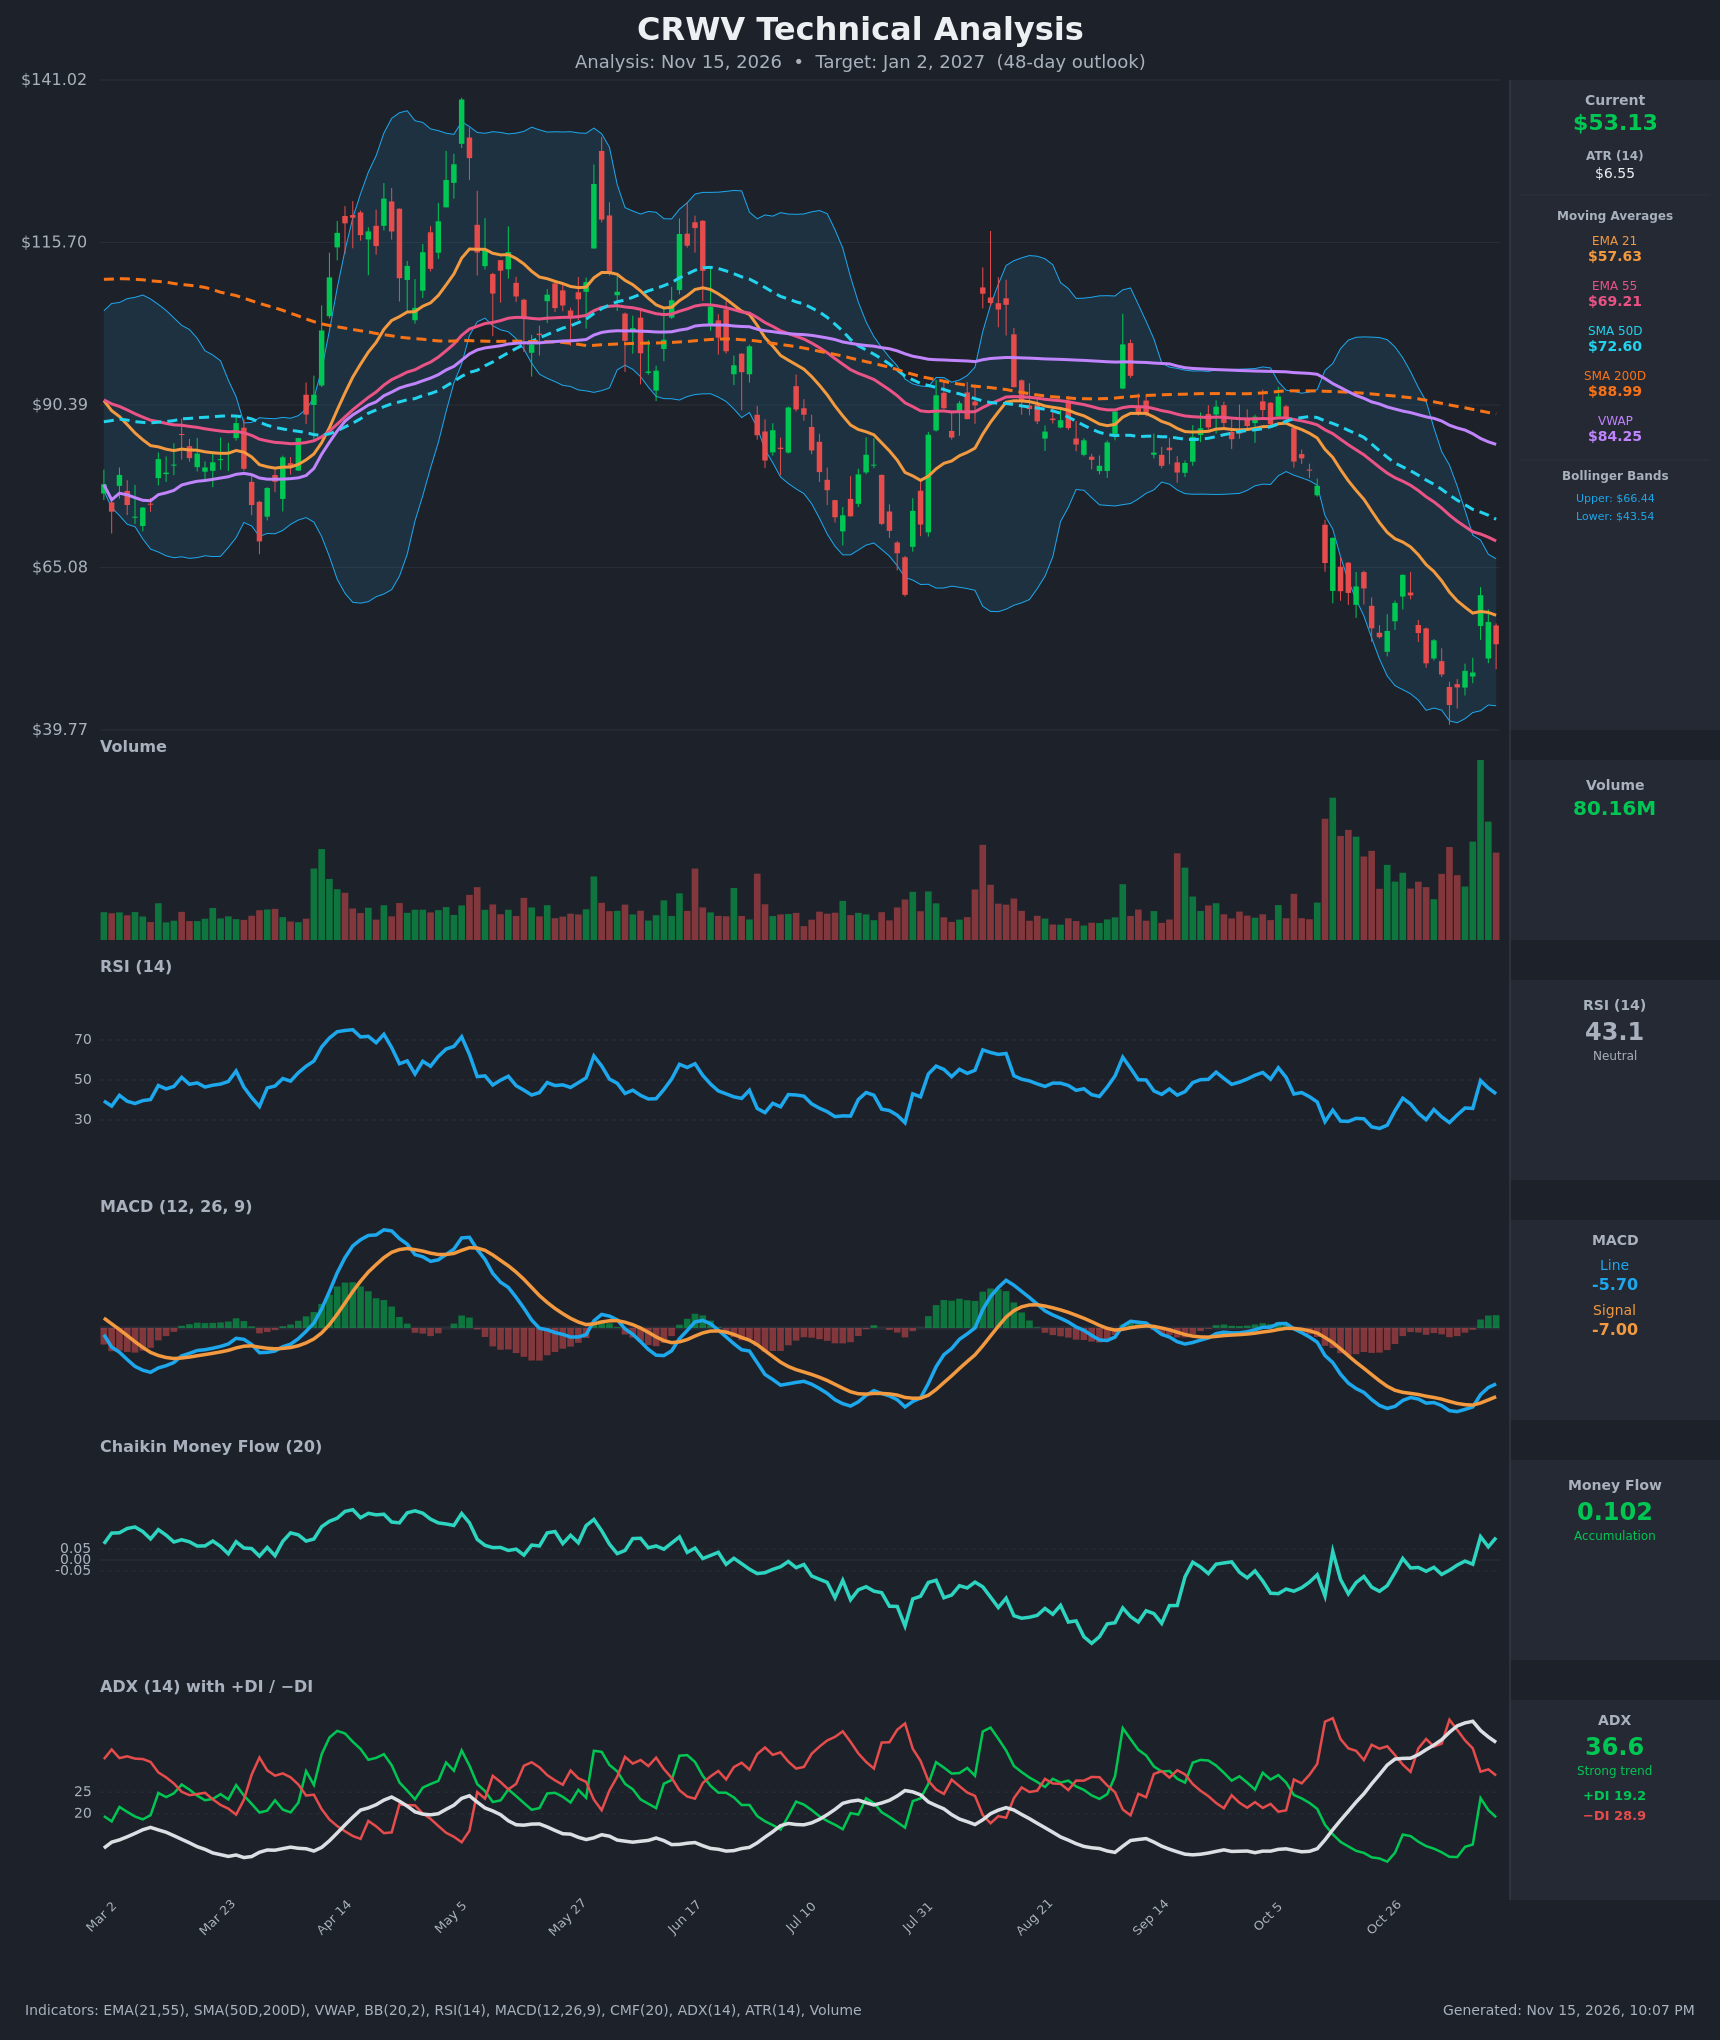
Analysis
TECHNICAL INDICATORS
- RSI (14): 43.11, recovering from oversold lows of 27.4 on Oct 26 and 28.7 on Nov 5. It peaked near 49.7 on the Nov 11 spike and has rolled over to 43.1. It is below the 50 midline, so the bounce is still unconfirmed. [Neutral]
- 20 EMA: EMA 21 is $57.63 and price ($53.13) sits below it. The EMA is still falling and acted as a ceiling on the Nov 11-12 bounce. EMA 21 is also below EMA 55 ($69.21), a bearish stack. [Bearish]
- MACD: The line (-5.70) has crossed above the signal (-7.00) for a histogram of about +1.30. The crossover happened on Nov 11-12, and the line has been rising for 4 sessions. It is still deep below zero, so this is a relief signal inside a downtrend. [Bullish]
- Bollinger Bands (20): Upper is $66.44, lower is $43.54, and the midline is about $55.00. Price is below the midline in the lower half of the band after tagging the lower band (low of $43.66 on Nov 5). The bands are wide, which means high volatility after the selloff. [Neutral]
- CMF (20): 0.102, above the +0.05 threshold and positive on 3 of the last 4 bars. Money flow is positive even though price made new lows, a bullish divergence. [Accumulation]
- ADX (14): 36.6, a strong trend, but it is off its peak of 41.5 and falling. −DI (28.9) is above +DI (19.2), so bears still control, though the gap has narrowed from about 31 points on Nov 5 to about 10. [Strong Trend - Bearish, fading]
- Volume: 80.16M, a very large reading, among the highest on the chart. It follows a run of heavy volume since mid-October. This looks like capitulation or high-turnover washout activity, but the latest candle is a pullback from the spike. [Elevated - capitulation/volatile]
DIVERGENCES & TRENDS
- Bullish divergence (RSI): Price made a lower low ($43.66 on Nov 5 vs $55.19 on Oct 26) while RSI made a marginally higher low (28.7 vs 27.4).
- Bullish divergence (CMF): CMF rose from -0.117 on Oct 26 to +0.102 now while price stayed near its lows, which points to accumulation.
- MACD: The bullish crossover on Nov 11-12 is a short-term positive, but it occurred far below zero.
- Long-term trend: This is a confirmed downtrend. Price is far below SMA 50 ($72.60), SMA 200 ($88.99) and VWAP ($84.25). SMA 50 is under SMA 200 (death cross), and EMA 21 is under EMA 55. Every moving average is sloping down.
- ADX: ADX is rolling over from a high reading, which usually means the downtrend is maturing. Price has not yet reclaimed EMA 21, so the downtrend has not been broken.
- Recent action: A spike to $60.77 on Nov 11 was sold down to $53.13 in two sessions. The EMA 21 / Bollinger midline zone ($55-58) is the near-term hurdle.
CHART PATTERNS
- Bullish Expanding Triangle (broadening, reversal): Since Oct 26 the swings have widened. The lows are $43.66 and $48.42, with highs at $63.93 and $60.77, and the volatility is expanding after a long decline. If it resolves upward, a break above about $61-64 targets the $70 zone (EMA 55 / SMA 50). This is not fully formed, so treat it as tentative.
- Bearish continuation risk: The failed bounce below EMA 21 looks like a lower high inside a larger downtrend (similar to a bearish flag or pennant). A close below $43.66 would target roughly $36-38.
- Overall: The pattern evidence is mixed. A bottoming or broadening formation has divergence support, but the larger structure is still bearish.
POTENTIAL SCENARIOS
- Scenario 1: Bullish Relief Rally / Base Formation — Price holds above the $48-49 area, the MACD crossover and positive CMF carry through, and price recovers EMA 21 and the Bollinger midline. Trigger: daily close above $57.63 and then $60.77. Target: $56-60, with an extension toward $66 (upper band). Invalidation: close below $48.40. (45% probability)
- Scenario 2: Bearish Trend Continuation — The bounce fails at the EMA 21 / midline, −DI stays on top, and price retests the lows. Trigger: close below $48.40, then below $43.66. Target: $43-44, with an extension toward $38. Invalidation: close above $60.77. (40% probability)
- Scenario 3: Neutral Choppy Consolidation — Price chops inside a wide $45-$60 range as ADX fades and the trend matures. Trigger: failure to break either $48.40 or $57.63. Target: $50-56. Invalidation: close outside the range. (15% probability)
PRICE TARGETS
Timeframe: 48 days (target date Jan 2, 2027). The range width is $9.50, which is 17.9% of the current price and fits the 30-60 day guidance of 12-18%.
- Target Price: $56.50 (a modest mean-reversion bounce toward EMA 21 and the Bollinger midline)
- Expected Range: $50.50 to $60.00
- Key Levels: Support at $48.42, Resistance at $57.63
OVERALL BIAS
OVERALL BIAS: BULLISH - Positive CMF, the MACD bullish crossover, and the RSI divergence off oversold lows after a capitulation-volume washout favor a relief bounce toward the $56-58 area. Conviction is modest because price is still below every major moving average and −DI is above +DI.
This is educational analysis and not financial advice.