CRWV 62-day bullish forecast — Nov 15, 2026
- Bias: Bullish
- Timeframe: 62 days (made Nov 15, 2026, target date Jan 15, 2027)
- Price at analysis: $53.13
- Price target: $57.00
- Expected range: $46.50 – $62.00
- Result: Pending — graded after the close on Jan 15, 2027
Get a free AI analysis of CRWV today
Analysis
TECHNICAL INDICATORS
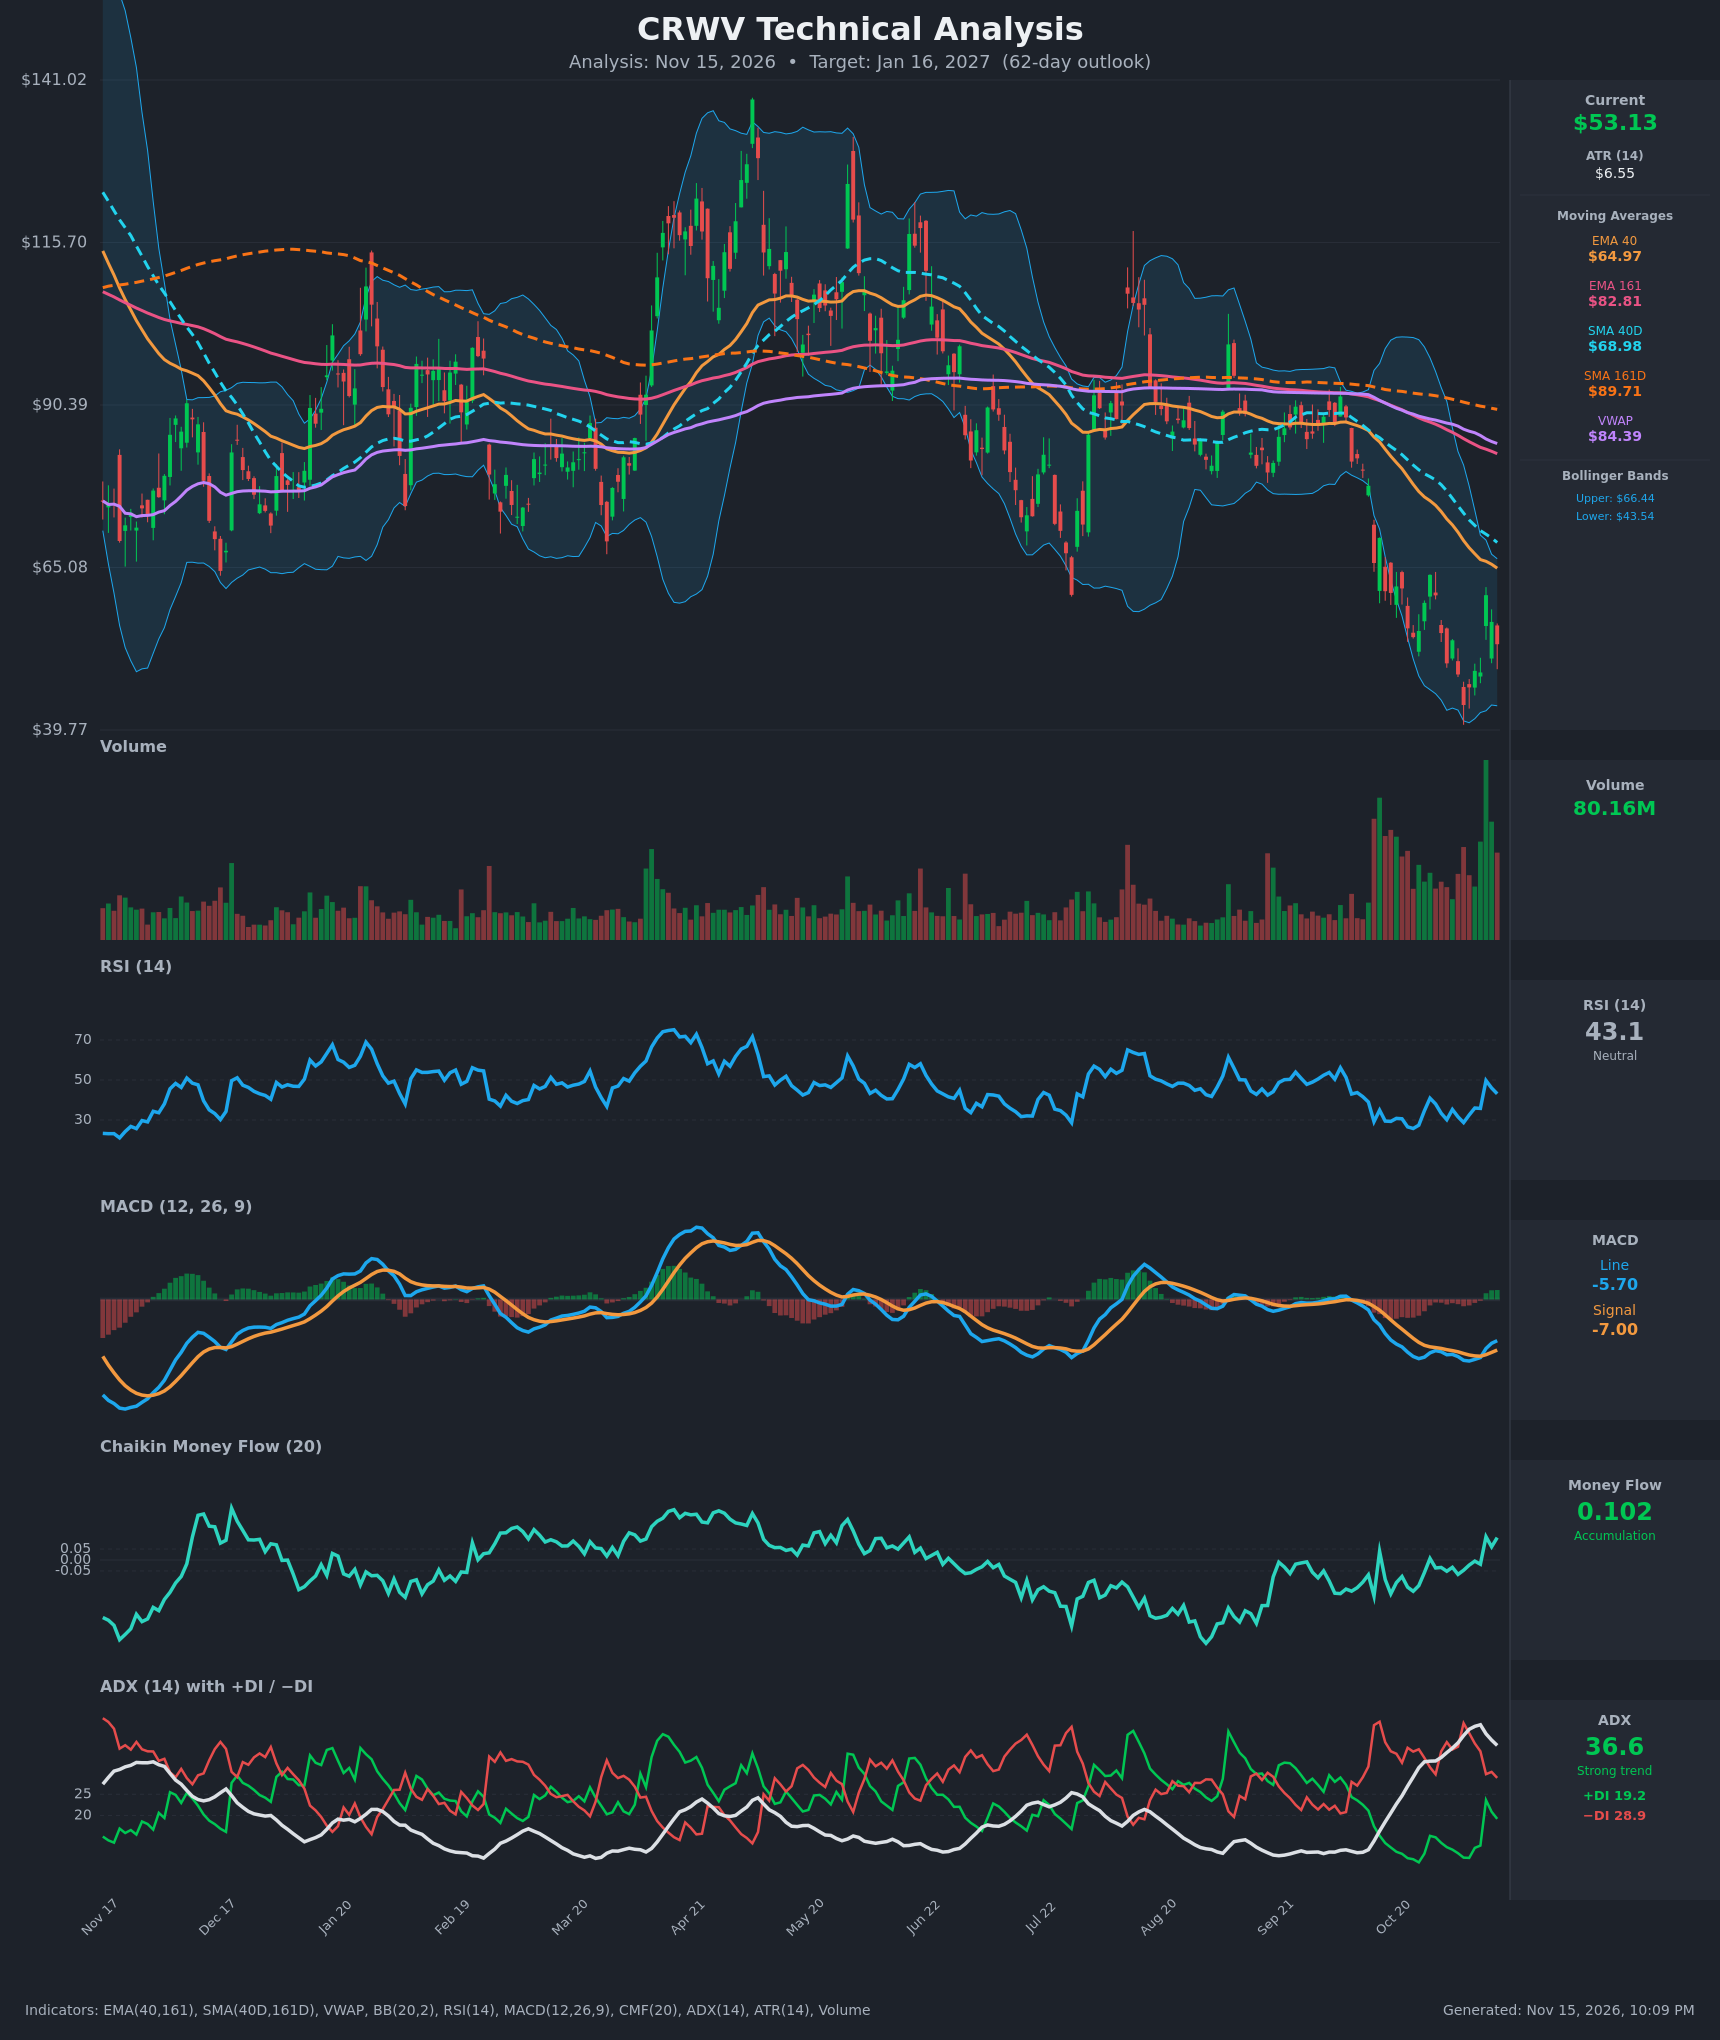
- RSI (14): 43.1. It has recovered from oversold readings (27.4 on Oct 26, 28.7 on Nov 5) and spiked to 49.7 on Nov 11 before fading. Momentum is improving off the lows but is rolling over again from the 50 line. [Neutral]
- 20 EMA (EMA 40 shown: $64.97): Price at $53.13 is about 18% below the EMA 40, which is falling and acting as overhead resistance. EMA 40 is also well below EMA 161 ($82.81), a bearish structure. [Bearish]
- MACD: Line -5.70 is above Signal -7.00, a bullish crossover that occurred around Nov 11. The histogram is positive and rising. Both lines remain deeply negative, so this is a relief signal inside a downtrend, not a trend reversal. [Bullish]
- Bollinger Bands (20): Upper $66.44, lower $43.54, midline about $55. Price is in the lower half after riding the lower band to $43.66 on Nov 5. The bands are wide, which signals high volatility, and the midline is the first resistance. [Neutral]
- CMF (20): +0.102, up from about -0.12 on Oct 26 and above the +0.05 threshold. Buying pressure is building even as price made lower lows, a bullish divergence. [Accumulation]
- ADX (14): 36.6, a strong trend, but it is off its peak of 41.5. −DI (28.9) is above +DI (19.2), so bears still control. The falling ADX and narrowing DI spread suggest the downtrend is losing steam. [Strong Trend – Bearish, fading]
- Volume: 80.16M, far above the typical level seen earlier in the year. The late-October to November sell-off came on climactic volume, which is consistent with capitulation or washout activity. The rejection from $60.77 shows supply is still present. [Capitulation volume – potential base, unconfirmed]
DIVERGENCES & TRENDS
- Bullish divergences: CMF turned positive while price made a lower low ($43.66 on Nov 5). RSI also held a similar low (28.7 vs 27.4) while price fell far lower.
- MACD: The bullish line/signal crossover with a positive histogram marks a momentum shift. The lines are still far below zero.
- Trend structure: Price is below every moving average. EMA 40 is below EMA 161, SMA40D ($68.98) is below SMA161D ($89.71), and price is below VWAP ($84.39). The SMA death cross has already occurred, so the long-term trend is firmly bearish.
- Lower highs: Price topped at $63.93 on Oct 28 and $60.77 on Nov 11, a descending sequence.
- ADX/DI: −DI is on top, but +DI jumped from 10 to 23.6 on Nov 11 and has since faded. ADX is rolling over from its peak, so trend exhaustion is possible.
CHART PATTERNS
- Bearish Flag / Descending channel: After the sharp drop from about $90 to $44, the bounce is making lower highs ($63.93, then $60.77). A rejection here would point to continuation lower, toward $40–44.
- Bullish Falling Wedge / Double Bottom candidate: The $43.66 low with the volume climax could form a base. A higher low above $44 followed by a break above $60.77 would favor a double bottom, with a measured move toward $63–66 (the upper Bollinger Band and EMA 40 zone).
- Significance: Neither pattern is confirmed. The bottoming evidence (CMF, MACD, volume capitulation) slightly outweighs the continuation evidence, but the major trend remains down and rallies face heavy resistance.
POTENTIAL SCENARIOS
- Scenario 1: Bullish Relief Rally / Base Formation — A higher low forms above $44–46 as accumulation continues, and price recovers toward the middle and upper Bollinger Band. Trigger: daily close above $60.77 (the Nov 11 high). Target: $62–66, with EMA 40 at about $65 acting as the ceiling. Invalidation: close below $43.66. (50% probability)
- Scenario 2: Bearish Trend Continuation — The bounce fails at the lower highs and the −DI-led downtrend resumes, with price retesting or breaking the November low. Trigger: close below $48.40 with MACD rolling back below its signal line. Target: $40–43. Invalidation: close above $60.77. (35% probability)
- Scenario 3: Neutral Range Consolidation — Price chops between $45 and $60 as volatility compresses after the washout. Trigger: failure to break either $60.77 or $43.66. Target: $50–56. Invalidation: close outside the range. (15% probability)
PRICE TARGETS
- Target Price: $57.00 (62-day horizon, Jan 16, 2027)
- Expected Range: $46.50 to $62.00 (width $15.50, about 29% of the current price, consistent with the 61–180 day guidance)
- Key Levels: Support at $48.40, Resistance at $60.77
OVERALL BIAS
OVERALL BIAS: BULLISH - Bullish divergences in CMF (+0.102) and RSI, a MACD bullish crossover, and a climactic-volume washout near the lower Bollinger Band favor a relief rally toward the mid-to-upper band. Conviction is modest because price remains below all major moving averages with −DI dominant and a death cross in place.
This is educational analysis and not financial advice.