CRWV 83-day bullish forecast — Nov 15, 2026
- Bias: Bullish
- Timeframe: 83 days (made Nov 15, 2026, target date Feb 5, 2027)
- Price at analysis: $53.13
- Price target: $57.50
- Expected range: $46.00 – $62.00
- Result: Pending — graded after the close on Feb 5, 2027
Get a free AI analysis of CRWV today
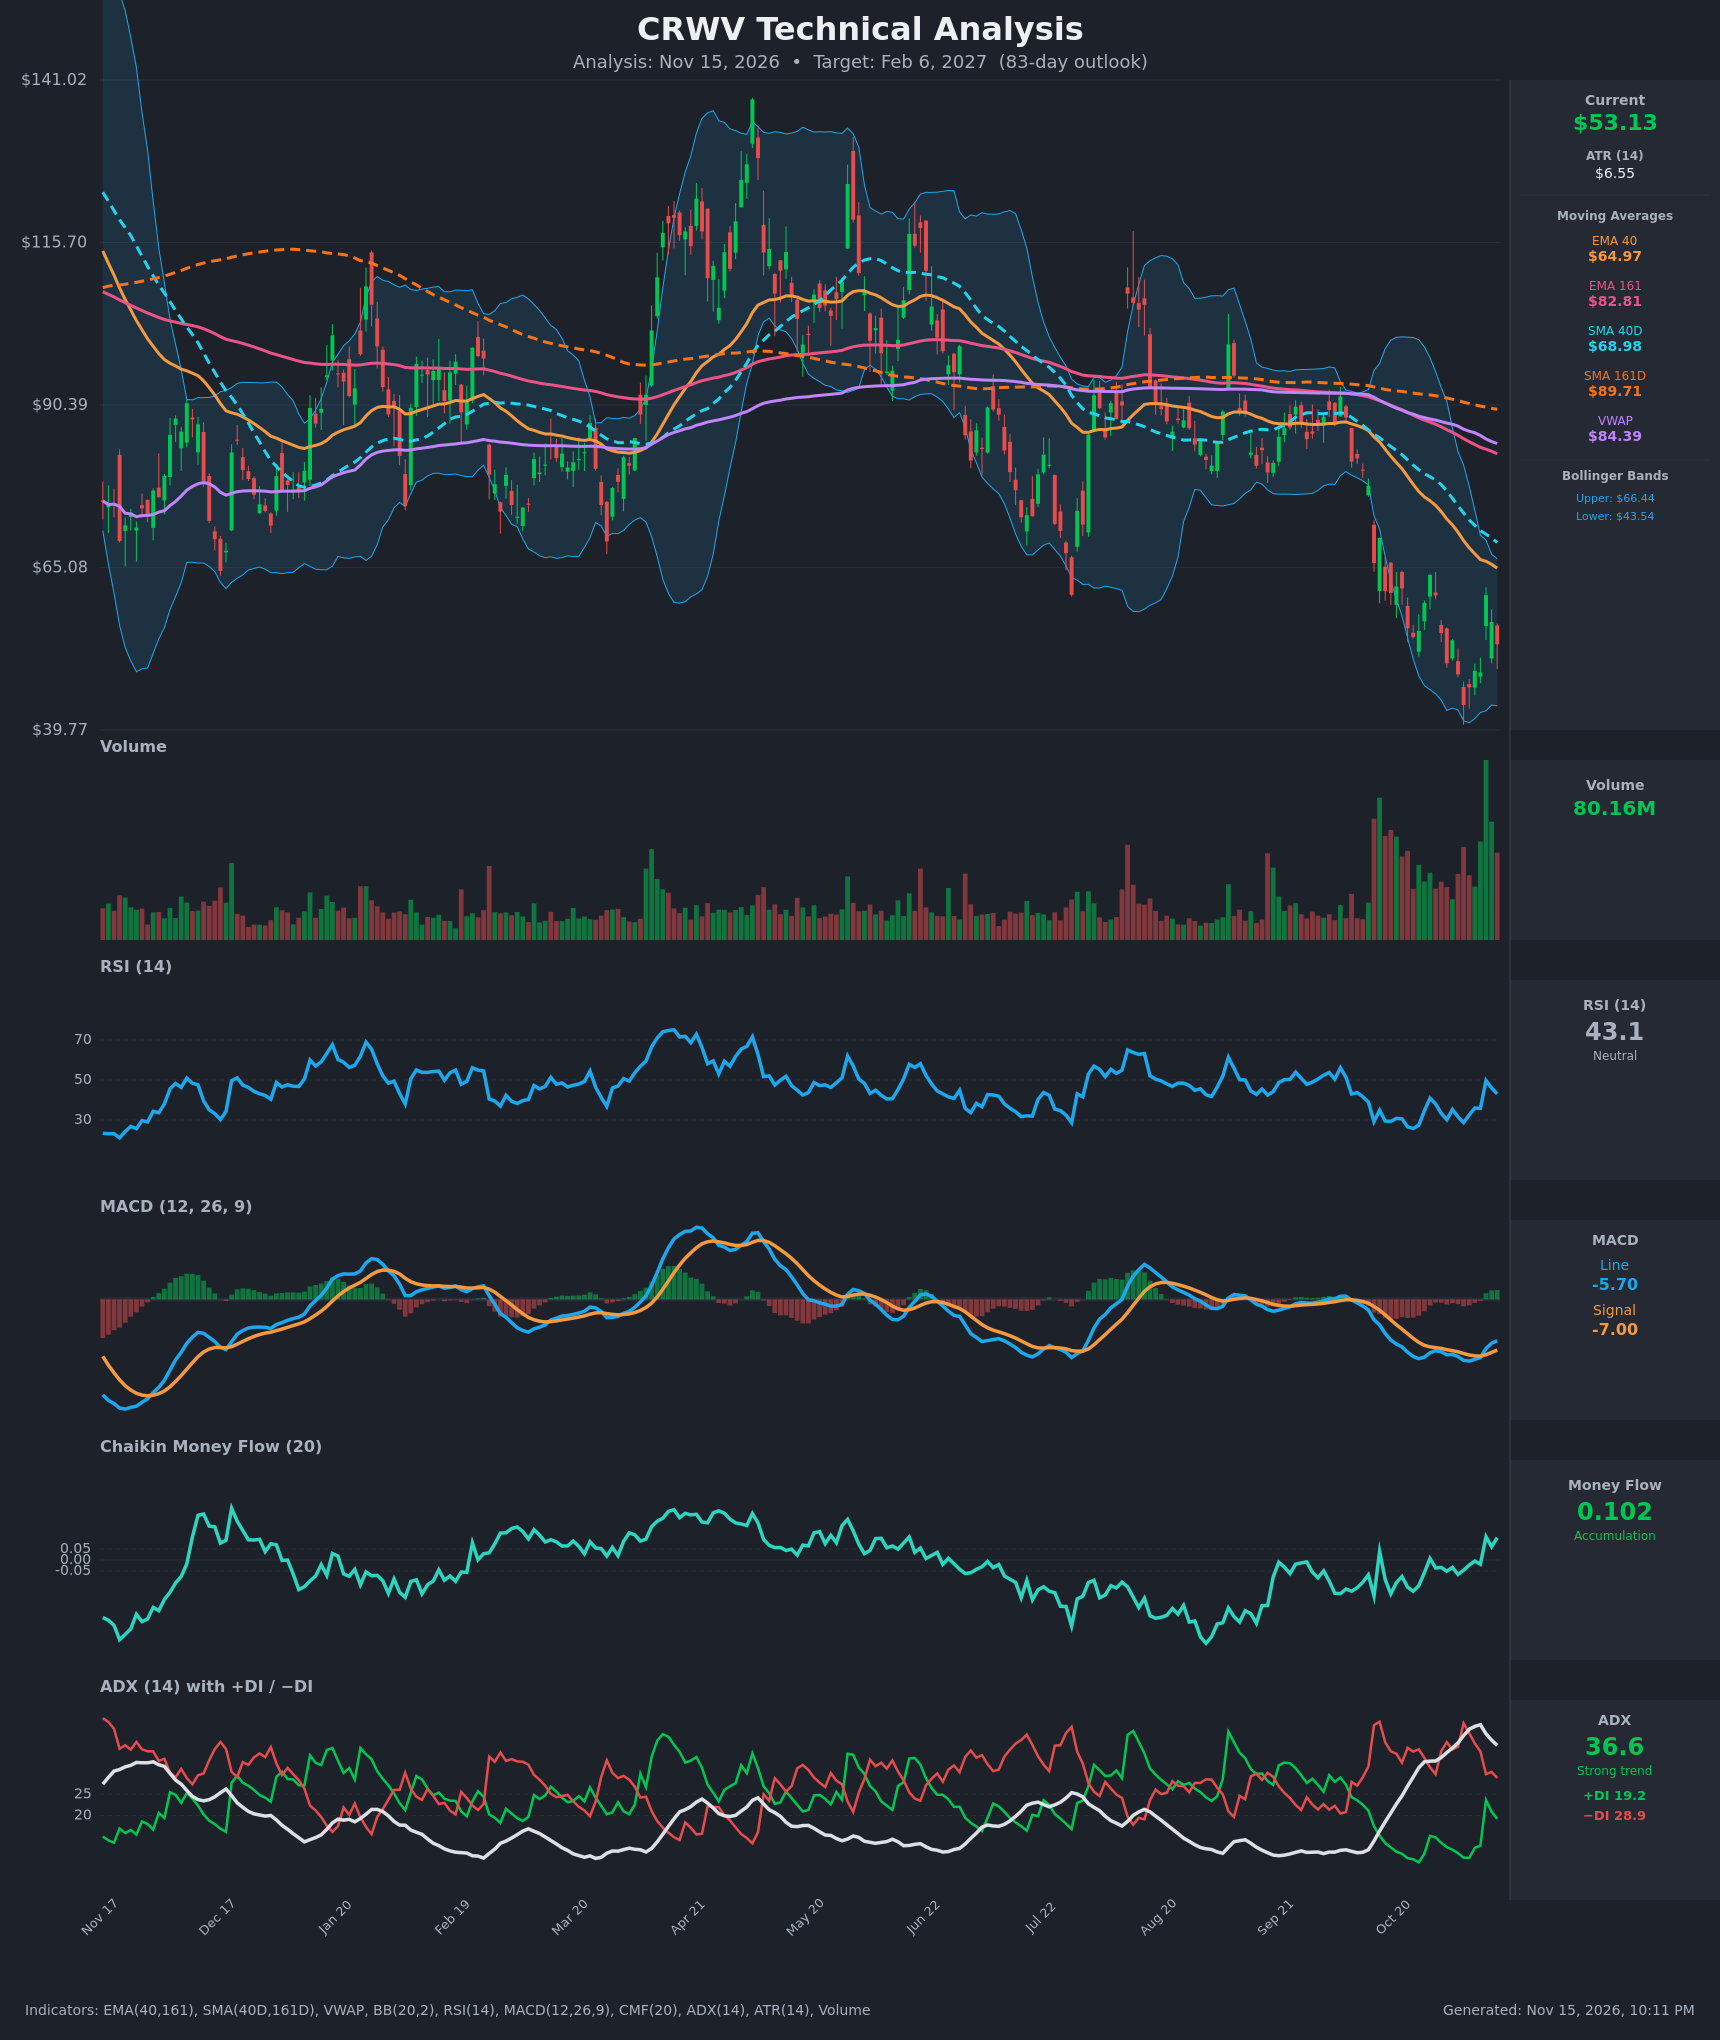
Analysis
TECHNICAL INDICATORS
- RSI (14): 43.1, recovering from oversold readings of 27-29 in late Oct and early Nov. It has made a slightly higher low (28.7 on Nov 5 vs 27.4 on Oct 26) while price made a lower low. It spiked to 49.7 on Nov 11 and has since rolled over to 43.1, so the bounce is stalling near the 50 line. [Neutral]
- 20 EMA: The data provides the EMA 40, at $64.97, with EMA 161 at $82.81. Price at $53.13 is about 18% below the EMA 40, and both EMAs are sloping down. The EMA 40 is well below the EMA 161, a confirmed bearish alignment. Overhead EMAs act as resistance, though the stretch from the mean leaves room for a relief rally. [Bearish]
- MACD: Line -5.70 is above Signal -7.00, so the histogram is positive and rising. The bullish crossover happened around Nov 11. Both lines remain deep below zero, so this is a relief signal inside a larger downtrend, not a trend reversal. [Bullish]
- Bollinger Bands (20): Upper $66.44, lower $43.54, midline about $55. Price is just below the midline after tagging the lower band area (the $43.66 close on Nov 5). The bands have expanded sharply, which reflects the high-volatility selloff. A recapture of the midline would favor a move toward the upper band. [Neutral]
- CMF (20): +0.102, in accumulation territory (above +0.05). It rose from -0.117 on Oct 26 to positive readings while price made new lows, which is a bullish divergence. Buyers are absorbing the heavy supply. [Accumulation]
- ADX (14): 36.6, a strong trend but falling from 41.5. −DI (28.9) is above +DI (19.2), so bears still control the trend. +DI has recovered from 8.9 and the gap is narrowing. The selling trend is maturing and losing steam. [Strong Trend – Bearish, weakening]
- Volume: 80.16M, among the heaviest bars on the chart. Very high volume came in near the lows, which is consistent with capitulation or climactic selling. The up bars on high volume (the Nov 11 spike) suggest dip buyers are present, but follow-through is needed. [Capitulation / possible bottoming]
DIVERGENCES & TRENDS
- Bullish divergence (RSI): price made a lower low ($43.66) while RSI held a slightly higher low (28.7 vs 27.4).
- Bullish divergence (CMF): it turned from -0.117 to +0.102 while price stayed near its lows, which points to accumulation.
- MACD: bullish line/signal crossover with a rising histogram, but both lines are still deeply negative.
- Major trend signals are bearish:
- Death cross: SMA40D ($68.98) is below SMA161D ($89.71).
- EMA40 is below EMA161.
- Price is below SMA161D, EMA161, VWAP ($84.39) and all other averages.
- DI: −DI remains on top, but the gap has narrowed from about 27 points to about 10.
- Relief rally: it peaked at $63.93 on Oct 28 and again at $60.77 on Nov 11, so each rally has failed at lower highs. The pullback to $53 tests whether buyers defend a higher low.
CHART PATTERNS
- Primary structure: a steep descending channel from about $90 down to $43.66. The bounces look like a Bearish Flag/Pennant continuation attempt, and the lower highs ($63.93, then $60.77) support that read.
- Bearish Flag target: a breakdown below roughly $48 would project toward $38-40.
- Tentative reversal: a Bullish Double Bottom is forming around $43-46 (lows at roughly $43.66 and the late-Oct/Nov test). The neckline is near $60-64, the prior rally highs. A close above $64 would confirm the pattern, with a measured move toward about $75-80.
- Neither pattern is confirmed. The bounce zone of $48-$61 is the decision area.
POTENTIAL SCENARIOS
- Scenario 1: Bullish Relief Rally / Double Bottom Base — The capitulation volume, RSI and CMF divergences and the MACD cross support a recovery toward the mean. Price builds a higher low above $48 and retests the EMA 40 zone. Trigger: daily close above $55 (the BB midline), then above $60.77. Target: $60-65 (EMA 40 / upper BB). Invalidation: close below $46. (45% probability)
- Scenario 2: Bearish Trend Continuation — The bounce fails as a bear flag. The death cross, −DI dominance and a high ADX keep sellers in control. Trigger: close below $48.40, then below $43.66. Target: $38-42. Invalidation: close above $61. (40% probability)
- Scenario 3: Neutral Range Consolidation — Price chops between $45 and $61 as volatility contracts and ADX fades below 25. Trigger: ADX falls and price pins around the $55 midline. Target: $50-58. Invalidation: close outside $44-$62. (15% probability)
PRICE TARGETS
For the 83-day horizon (about Feb 6, 2027):
- Target Price: $57.50
- Expected Range: $46.00 to $62.00. The width is $16, about 30% of the current price. That fits the 61-180 day guidance and reflects the high ATR of $6.55 (12% of price).
- Key Levels: Support at $48.40, Resistance at $60.77. Below support, the $43.66 swing low is the major floor. Above resistance, the $64.97 EMA 40 / BB upper zone is the next ceiling.
OVERALL BIAS
OVERALL BIAS: BULLISH - Climactic volume, bullish RSI and CMF divergences, and a MACD crossover favor a modest mean-reversion rally from deeply oversold levels. Conviction is modest, because the death cross, −DI dominance and a strong ADX keep the larger trend bearish. A failure below $48.40 would flip the odds toward the downside.
This is educational analysis and not financial advice.