CRWV 6-day bearish forecast — Nov 1, 2026
- Bias: Bearish
- Timeframe: 6 days (made Nov 1, 2026, target date Nov 6, 2026)
- Price at analysis: $54.98
- Price target: $53.60
- Expected range: $51.40 – $55.60
- Result: Correct (-15.3%) — closed at $46.56 on Nov 6, 2026; quality score 50/100
Get a free AI analysis of CRWV today
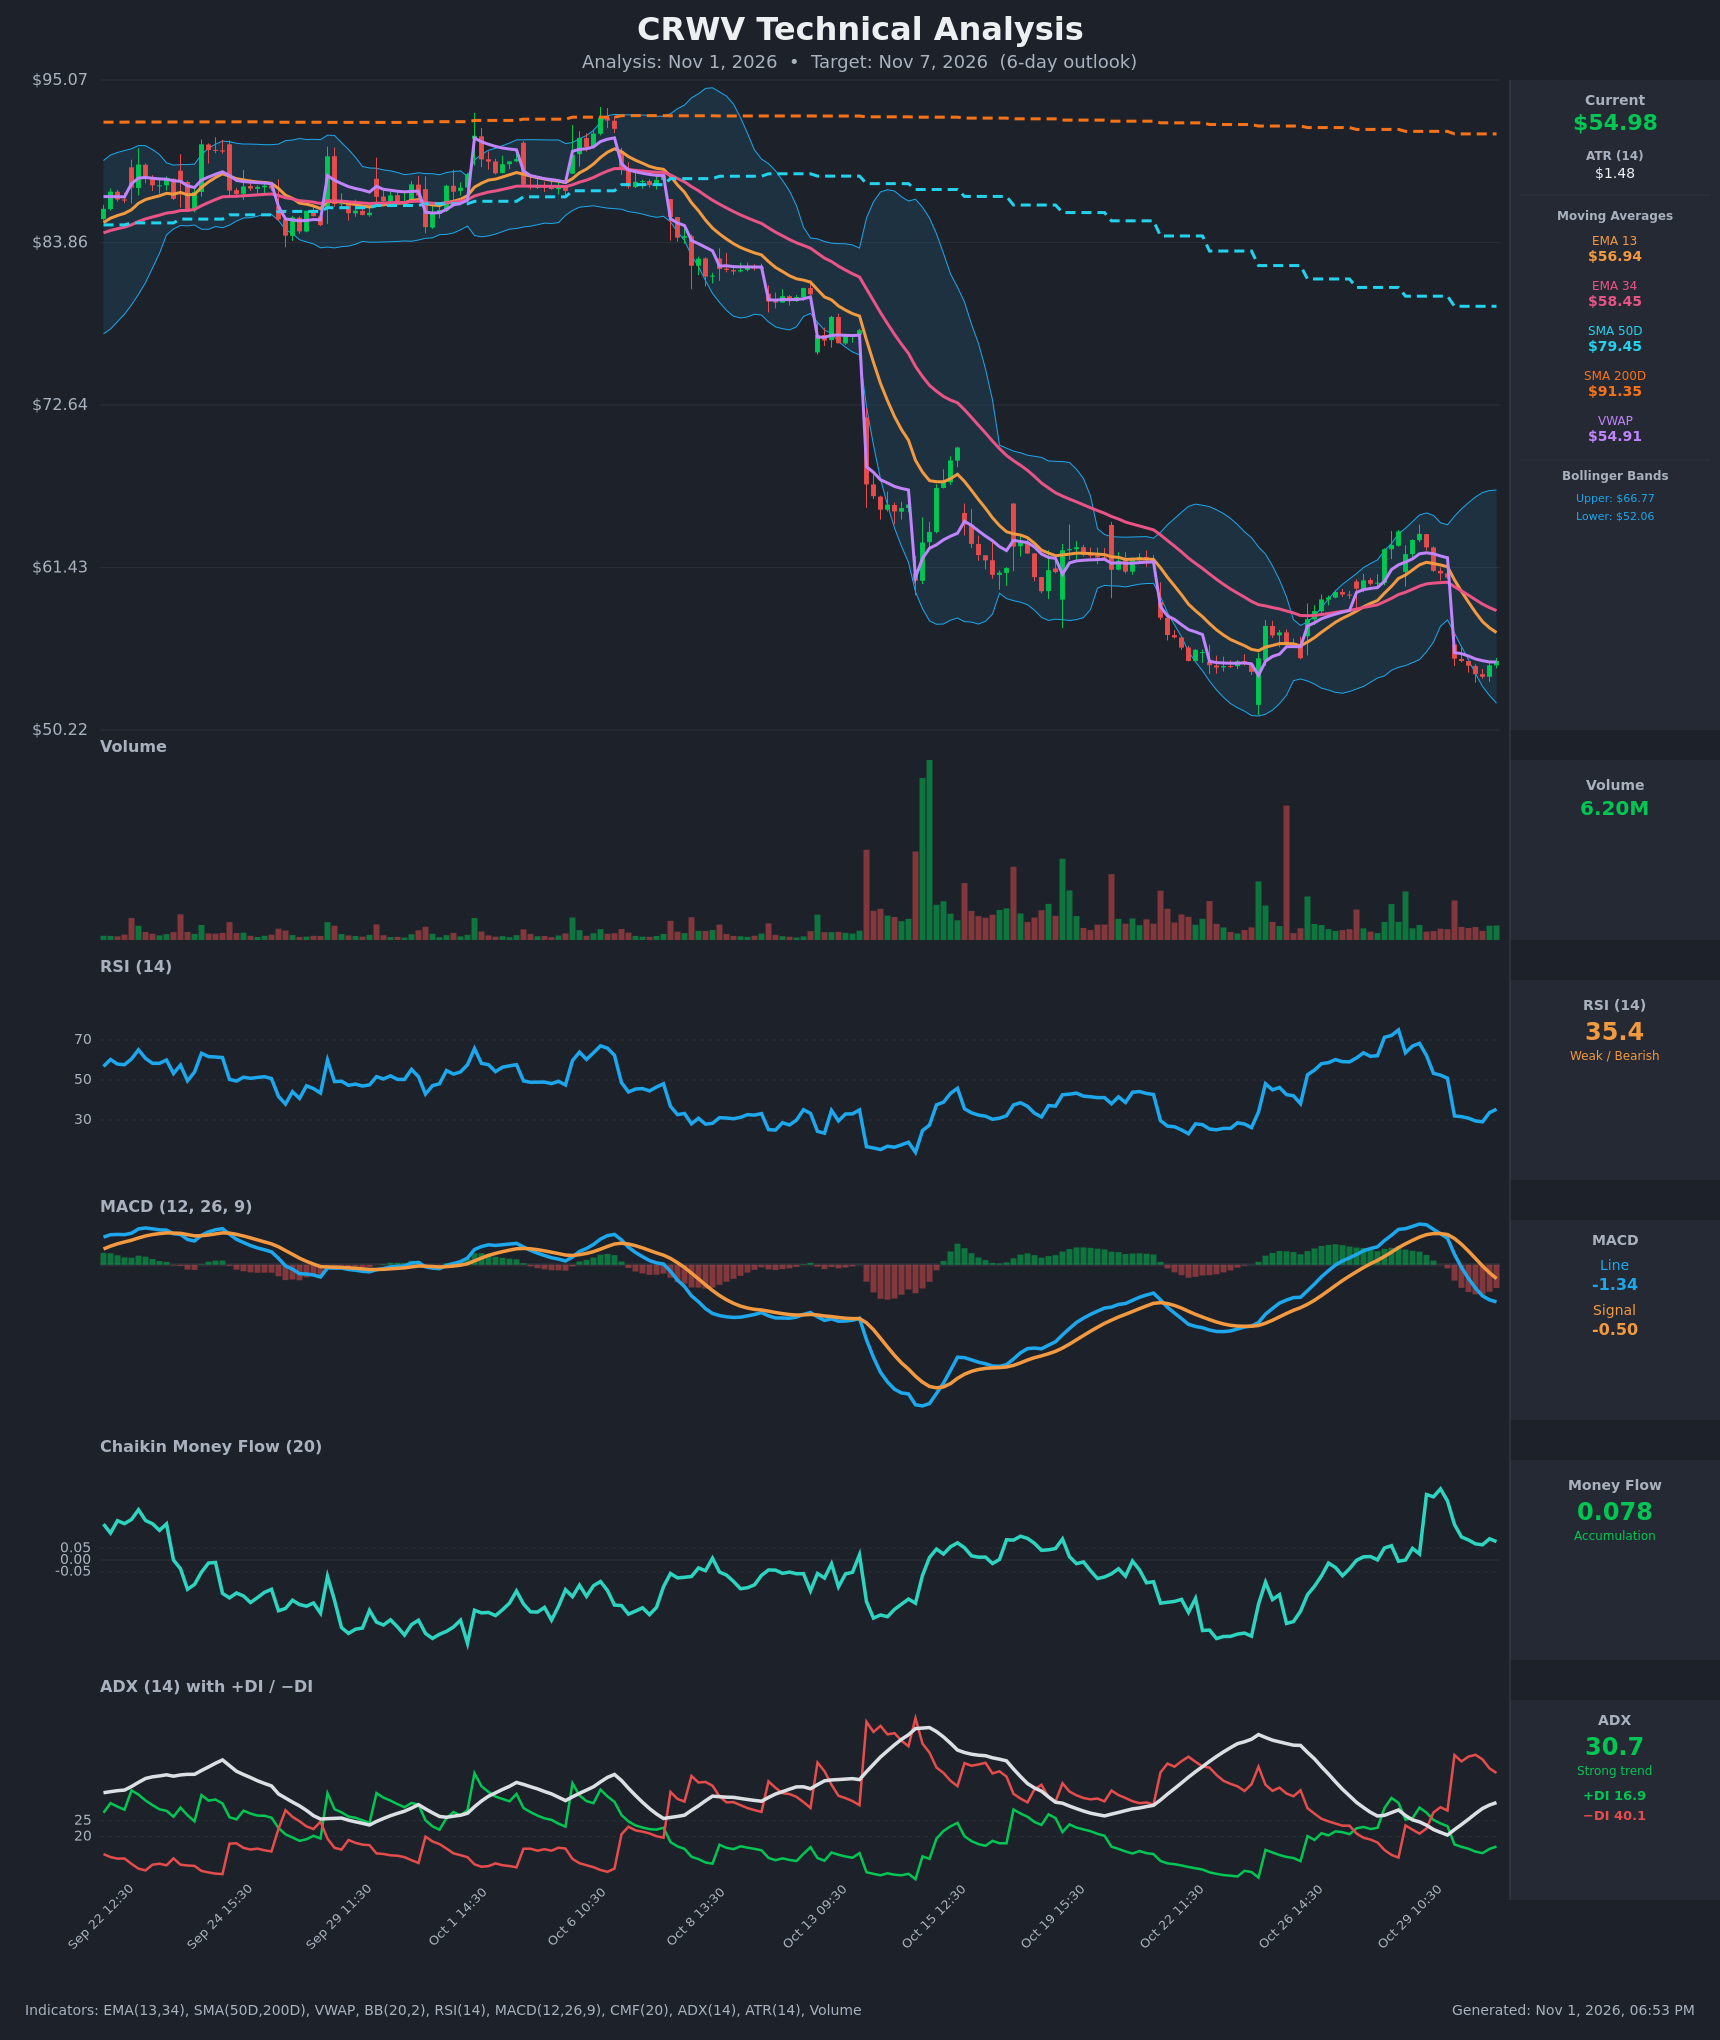
Analysis
TECHNICAL INDICATORS
- RSI (14): 35.39. It fell from about 75 on Oct 28 to the low 30s and ticked up slightly from 29.1 to 35.4 at the last bar. That is near oversold but still below 40, so momentum is bearish with a possible bounce setup. [Bearish]
- 20 EMA: Only EMA 13 ($56.94) and EMA 34 ($58.45) are provided. Price at $54.98 is below both, and EMA 13 crossed below EMA 34 on Oct 30, a bearish crossover. Both averages are now overhead resistance. [Bearish]
- MACD: The line (-1.34) crossed below the signal (-0.50) and is below zero. The histogram is negative and widening, so downside momentum is still building. [Bearish]
- Bollinger Bands (20): Upper $66.77, lower $52.06, with price at $54.98 in the lower third. The bands are wide after the volatile swing. A walk toward the lower band is possible, and a touch of $52 could trigger a mean-reversion bounce. [Bearish]
- CMF (20): 0.078, above the +0.05 threshold. It has stayed positive during the selloff, so buyers are absorbing some of the selling. That is a mild divergence against the price weakness. [Accumulation]
- ADX (14): 30.7 and rising, with −DI at 40.1 far above +DI at 16.9. This is a strong, bear-controlled trend, and the gap between the DIs is wide. [Strong Trend – Bearish]
- Volume: 6.20M on the latest bar, moderate and below the spikes seen during the early-October breakdown. The Oct 30 gap down from $60.72 to $55.14 shows heavy selling pressure. Price is sitting right at VWAP ($54.91), which is a pivot level. [Neutral to Bearish]
DIVERGENCES & TRENDS
- CMF divergence: CMF is positive (0.078) while price makes lower lows, so some accumulation is occurring. This could support a bounce, but it has not stopped the decline.
- RSI: It has made a small higher low from 29.1 to 35.4, which suggests the selling is slowing. It is not a confirmed bullish divergence.
- Moving averages: SMA 50D ($79.45) is far below SMA 200D ($91.35), a long-standing death-cross configuration. Price is about 40% below SMA 200D, a long-term downtrend.
- EMA/MACD crossovers: EMA 13 crossed below EMA 34 and the MACD bearish crossover is fresh, both confirming near-term downside.
- DI structure: −DI jumped above +DI after the gap down, and ADX is turning back up from 20.5 to 30.7. The trend is reaccelerating.
- VWAP: Price is flat against VWAP, a short-term equilibrium that is a decision point.
CHART PATTERNS
- Bearish continuation structure: Price made a lower high near $64 after the October low near $51, then gapped down. This resembles a Bearish Flag/Rising Wedge continuation, where the rally from $51 to $64 was a corrective upward channel that has now broken down. The measured move points toward or below the prior low of about $51.
- Possible Bullish Double Bottom: Price is approaching the Oct 24 low near $51–52. If it holds and rebounds above the EMA 13 at about $57, a double-bottom reversal would be in play. This is not yet confirmed.
- Lower highs and lower lows since the early-October peak near $90 confirm the dominant downtrend.
POTENTIAL SCENARIOS
- Scenario 1: Bearish Trend Continuation — Sellers retain control, with −DI dominant and a fresh MACD bearish cross. Price drifts toward the lower Bollinger Band and the prior swing low. Trigger: a break below $54.00 and the $52.06 lower band. Target: $52.00–$53.50. Invalidation: a close above EMA 13 at $56.94. (50% probability)
- Scenario 2: Bullish Oversold Bounce — RSI near 30 and positive CMF fuel a relief rally, possibly forming a double bottom near $52–$51. Trigger: a hold above $52 and a reclaim of VWAP/$56. Target: $56.90–$58.45 (EMA 13/EMA 34 zone). Invalidation: a close below $52.00. (35% probability)
- Scenario 3: Neutral Range Chop — Price consolidates around VWAP between the lower band and EMA 13 as ADX peaks. Trigger: failure to break either $52 or $57. Target: $53.50–$56.00. Invalidation: a decisive break of either range edge. (15% probability)
PRICE TARGETS
- Target Price: $53.60 (6-day horizon, about 2.5% below current)
- Expected Range: $51.40 to $55.60 (width $4.20, about 7.6% of current price, consistent with the 4–8% guidance for a 6-day window)
- Key Levels: Support at $52.06, Resistance at $56.94
OVERALL BIAS
OVERALL BIAS: BEARISH - Price is below all key moving averages, with a bearish MACD crossover, a strong ADX of 30.7 and −DI at 40.1 versus +DI at 16.9. The trend is likely to continue toward $52–$53.50, though an oversold RSI and positive CMF raise the risk of a bounce.
This is educational analysis and not financial advice.