F 4-day bullish forecast — Nov 1, 2026
- Bias: Bullish
- Timeframe: 4 days (made Nov 1, 2026, target date Nov 4, 2026)
- Price at analysis: $12.23
- Price target: $12.33
- Expected range: $11.98 – $12.52
- Result: Correct (+3.6%) — closed at $12.67 on Nov 4, 2026; quality score 82/100
Get a free AI analysis of F today
Analysis
TECHNICAL INDICATORS
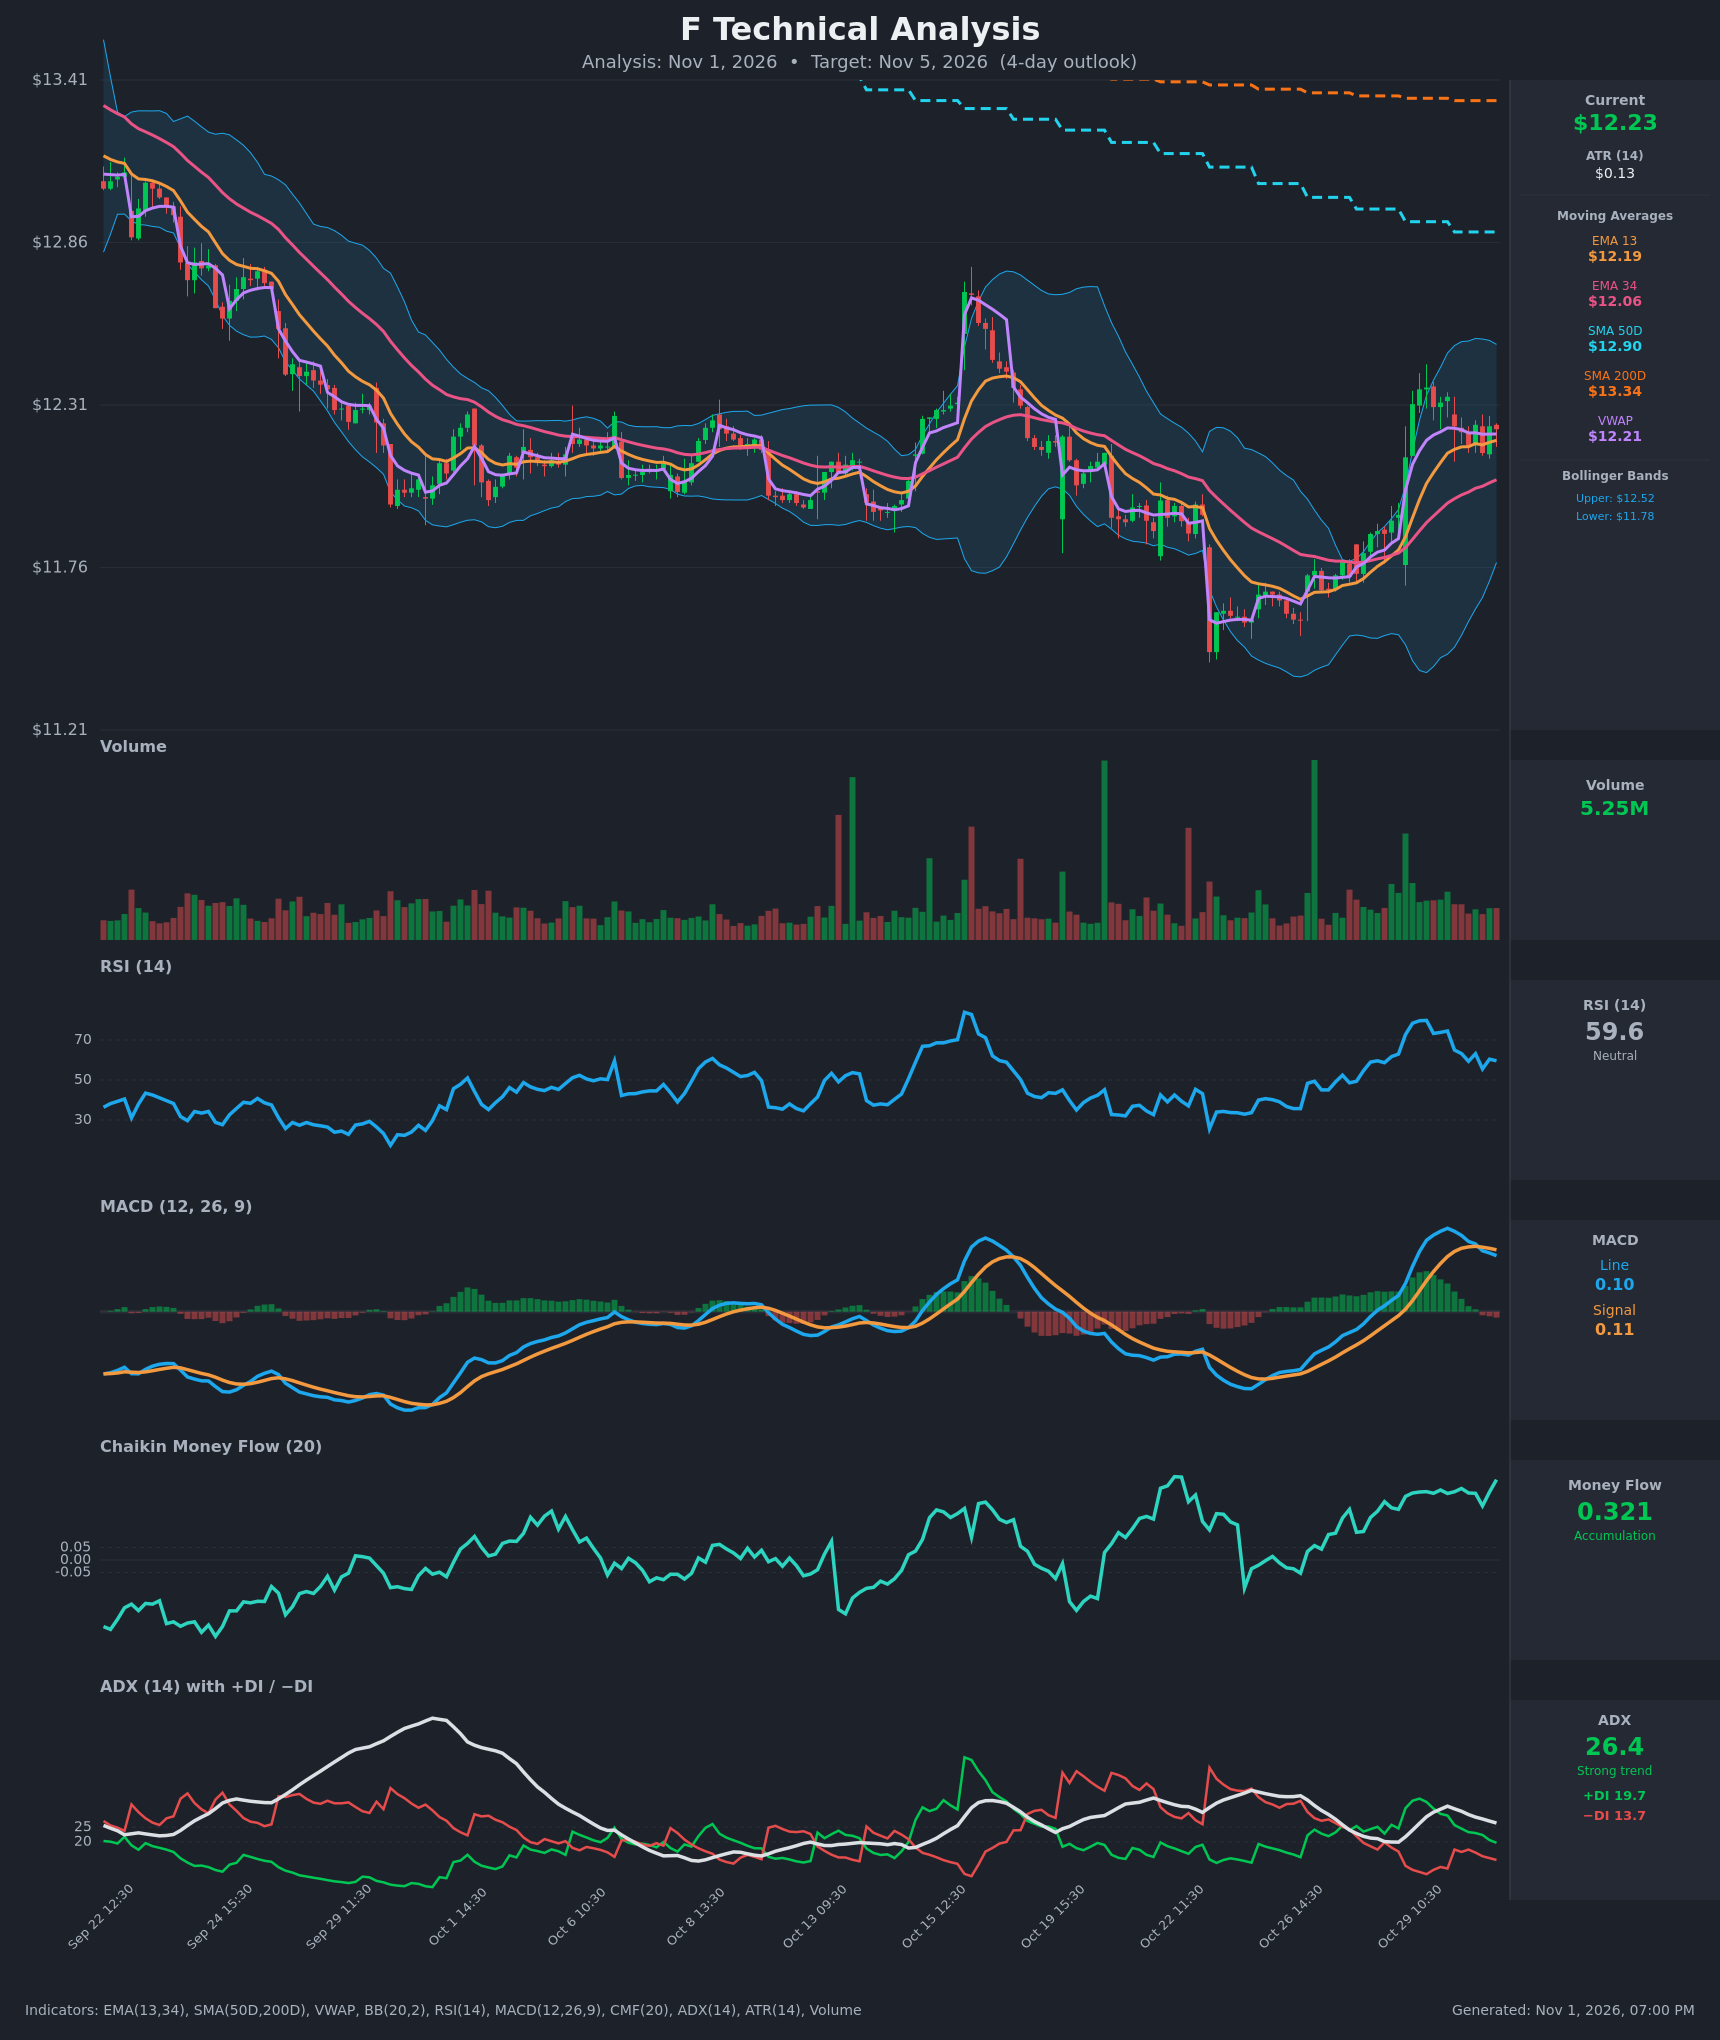
- RSI (14): 59.62, down from the 79.8 overbought peak on Oct 29 and now in neutral territory. The overbought condition has been worked off without a collapse, and momentum is cooling but still above 50. [Neutral]
- 20 EMA: The data gives EMA 13 at $12.19 and EMA 34 at $12.06. Price ($12.23) is above both, and EMA 13 is above EMA 34 with both rising, so the short-term stack is bullish. EMA 13 is the first support, and price has been hugging it. [Bullish]
- MACD: Line 0.103 vs. signal 0.114. The line crossed below the signal around Oct 30 13:30, and the histogram is slightly negative. Both lines are still positive but rolling over from the 0.154 peak, so this is a mild bearish momentum fade. [Bearish]
- Bollinger Bands (20): Upper $12.52, lower $11.78, mid-band roughly $12.15. Price is just above the midline, in the upper-middle of the range. The bands have expanded after the rally, and there is room to the upper band (~$0.29) without any squeeze signal. [Neutral]
- CMF (20): 0.321, sustained above +0.05 and near the highs of the recent range. This is strong accumulation, and buyers have been absorbing the sideways action. [Accumulation]
- ADX (14): 26.4 and falling from 32.2, with +DI 19.7 above −DI 13.7. The trend is still technically strong and bullish-led, but it is weakening, and the DI spread has narrowed from ~24 points to 6. [Strong Trend, Bullish but fading]
- Volume: 5.25M, ordinary to below-average compared with the spike bars on the Oct 29 breakout. The consolidation is happening on subdued volume, which is typical of a pause rather than distribution. [Neutral / consolidating]
Price is also above VWAP ($12.21) by a hair, and it remains below SMA50D ($12.90) and SMA200D ($13.34). The SMA50 is below the SMA200 (a death-cross configuration), so the longer-term trend is still down and those averages are overhead resistance.
DIVERGENCES & TRENDS
- Momentum fade: RSI has fallen from ~80 to ~60 and the MACD line has crossed below its signal, while price has held its gains. This is a mild momentum cooldown, not a classic divergence, since price has not made a new high.
- Trend strength: ADX is declining from 32 toward 26, and +DI has dropped from 35 to ~20. The impulse is losing power, which points to consolidation.
- Money flow: CMF is rising to ~0.32 while price moves sideways. This is a bullish divergence that suggests buying pressure under the surface.
- Crossovers: EMA 13 is above EMA 34 (bullish). The MACD signal cross is bearish. There is no golden cross, and the SMA50 remains below the SMA200 (long-term bearish).
- Higher lows: Price has been making higher lows since the ~$11.50 bottom and is holding above rising EMAs.
CHART PATTERNS
- Bullish Flag / Pennant (continuation): After the sharp rally from ~$11.55 to ~$12.40, price has consolidated in a narrow $12.15–$12.37 band with lower volatility. This is the closest match to the Bullish Flag/Pennant in the reference diagram. A break above ~$12.37–$12.40 projects a measured move toward the upper Bollinger Band at ~$12.52, with an extended target near ~$12.70.
- Overhead resistance: The falling SMA50D (~$12.90) and SMA200D (~$13.34) cap the larger rebound. This is a bear-market rally within a larger downtrend, so upside is likely to be limited.
- Failure condition: A close below ~$12.15 (EMA 13 and the consolidation floor) would negate the flag and expose $12.06 and then $11.90.
POTENTIAL SCENARIOS
- Scenario 1: Bullish Flag Breakout — Price holds the EMA 13 / VWAP zone, CMF accumulation carries through, and price breaks above the consolidation high. Trigger: close above $12.37 with improving volume and the MACD re-crossing above its signal. Target: $12.45–$12.55 (upper Bollinger Band). Invalidation: close below $12.12. (45% probability)
- Scenario 2: Neutral Range Consolidation — Fading ADX and a flat MACD keep price pinned between $12.10 and $12.40 while the EMAs catch up. Trigger: no decisive close outside the $12.15–$12.37 band. Target: $12.15–$12.35. Invalidation: close above $12.40 or below $12.10. (30% probability)
- Scenario 3: Bearish Pullback — The MACD bearish cross extends, and sellers push price back to the EMA 34 as momentum fades under the SMA50 resistance. Trigger: close below $12.15 on rising volume. Target: $12.00–$12.06, with an extension to ~$11.90. Invalidation: reclaim of $12.30. (25% probability)
PRICE TARGETS
- Target Price: $12.33 (4-day horizon)
- Expected Range: $11.98 to $12.52 (width $0.54, about 4.4% of the current price, scaled for a 4-day horizon and roughly consistent with ATR-based volatility over ~26 hourly bars)
- Key Levels: Support at $12.06 (EMA 34, just below the $12.19 EMA 13), Resistance at $12.52 (upper Bollinger Band, just above the recent highs near $12.37–$12.45)
OVERALL BIAS
OVERALL BIAS: BULLISH - Price is above rising EMAs and VWAP, CMF shows strong accumulation (0.32), and +DI leads −DI within a flag-like consolidation after a strong rally. The MACD cross, the fading ADX, and the overhead SMA50/200 limit the upside, so this is a modest-conviction call for a drift toward ~$12.33.
This is educational analysis and not financial advice.