F 27-day bearish forecast — Nov 15, 2026
- Bias: Bearish
- Timeframe: 27 days (made Nov 15, 2026, target date Dec 11, 2026)
- Price at analysis: $11.91
- Price target: $11.55
- Expected range: $10.85 – $12.60
- Result: Pending — graded after the close on Dec 11, 2026
Get a free AI analysis of F today
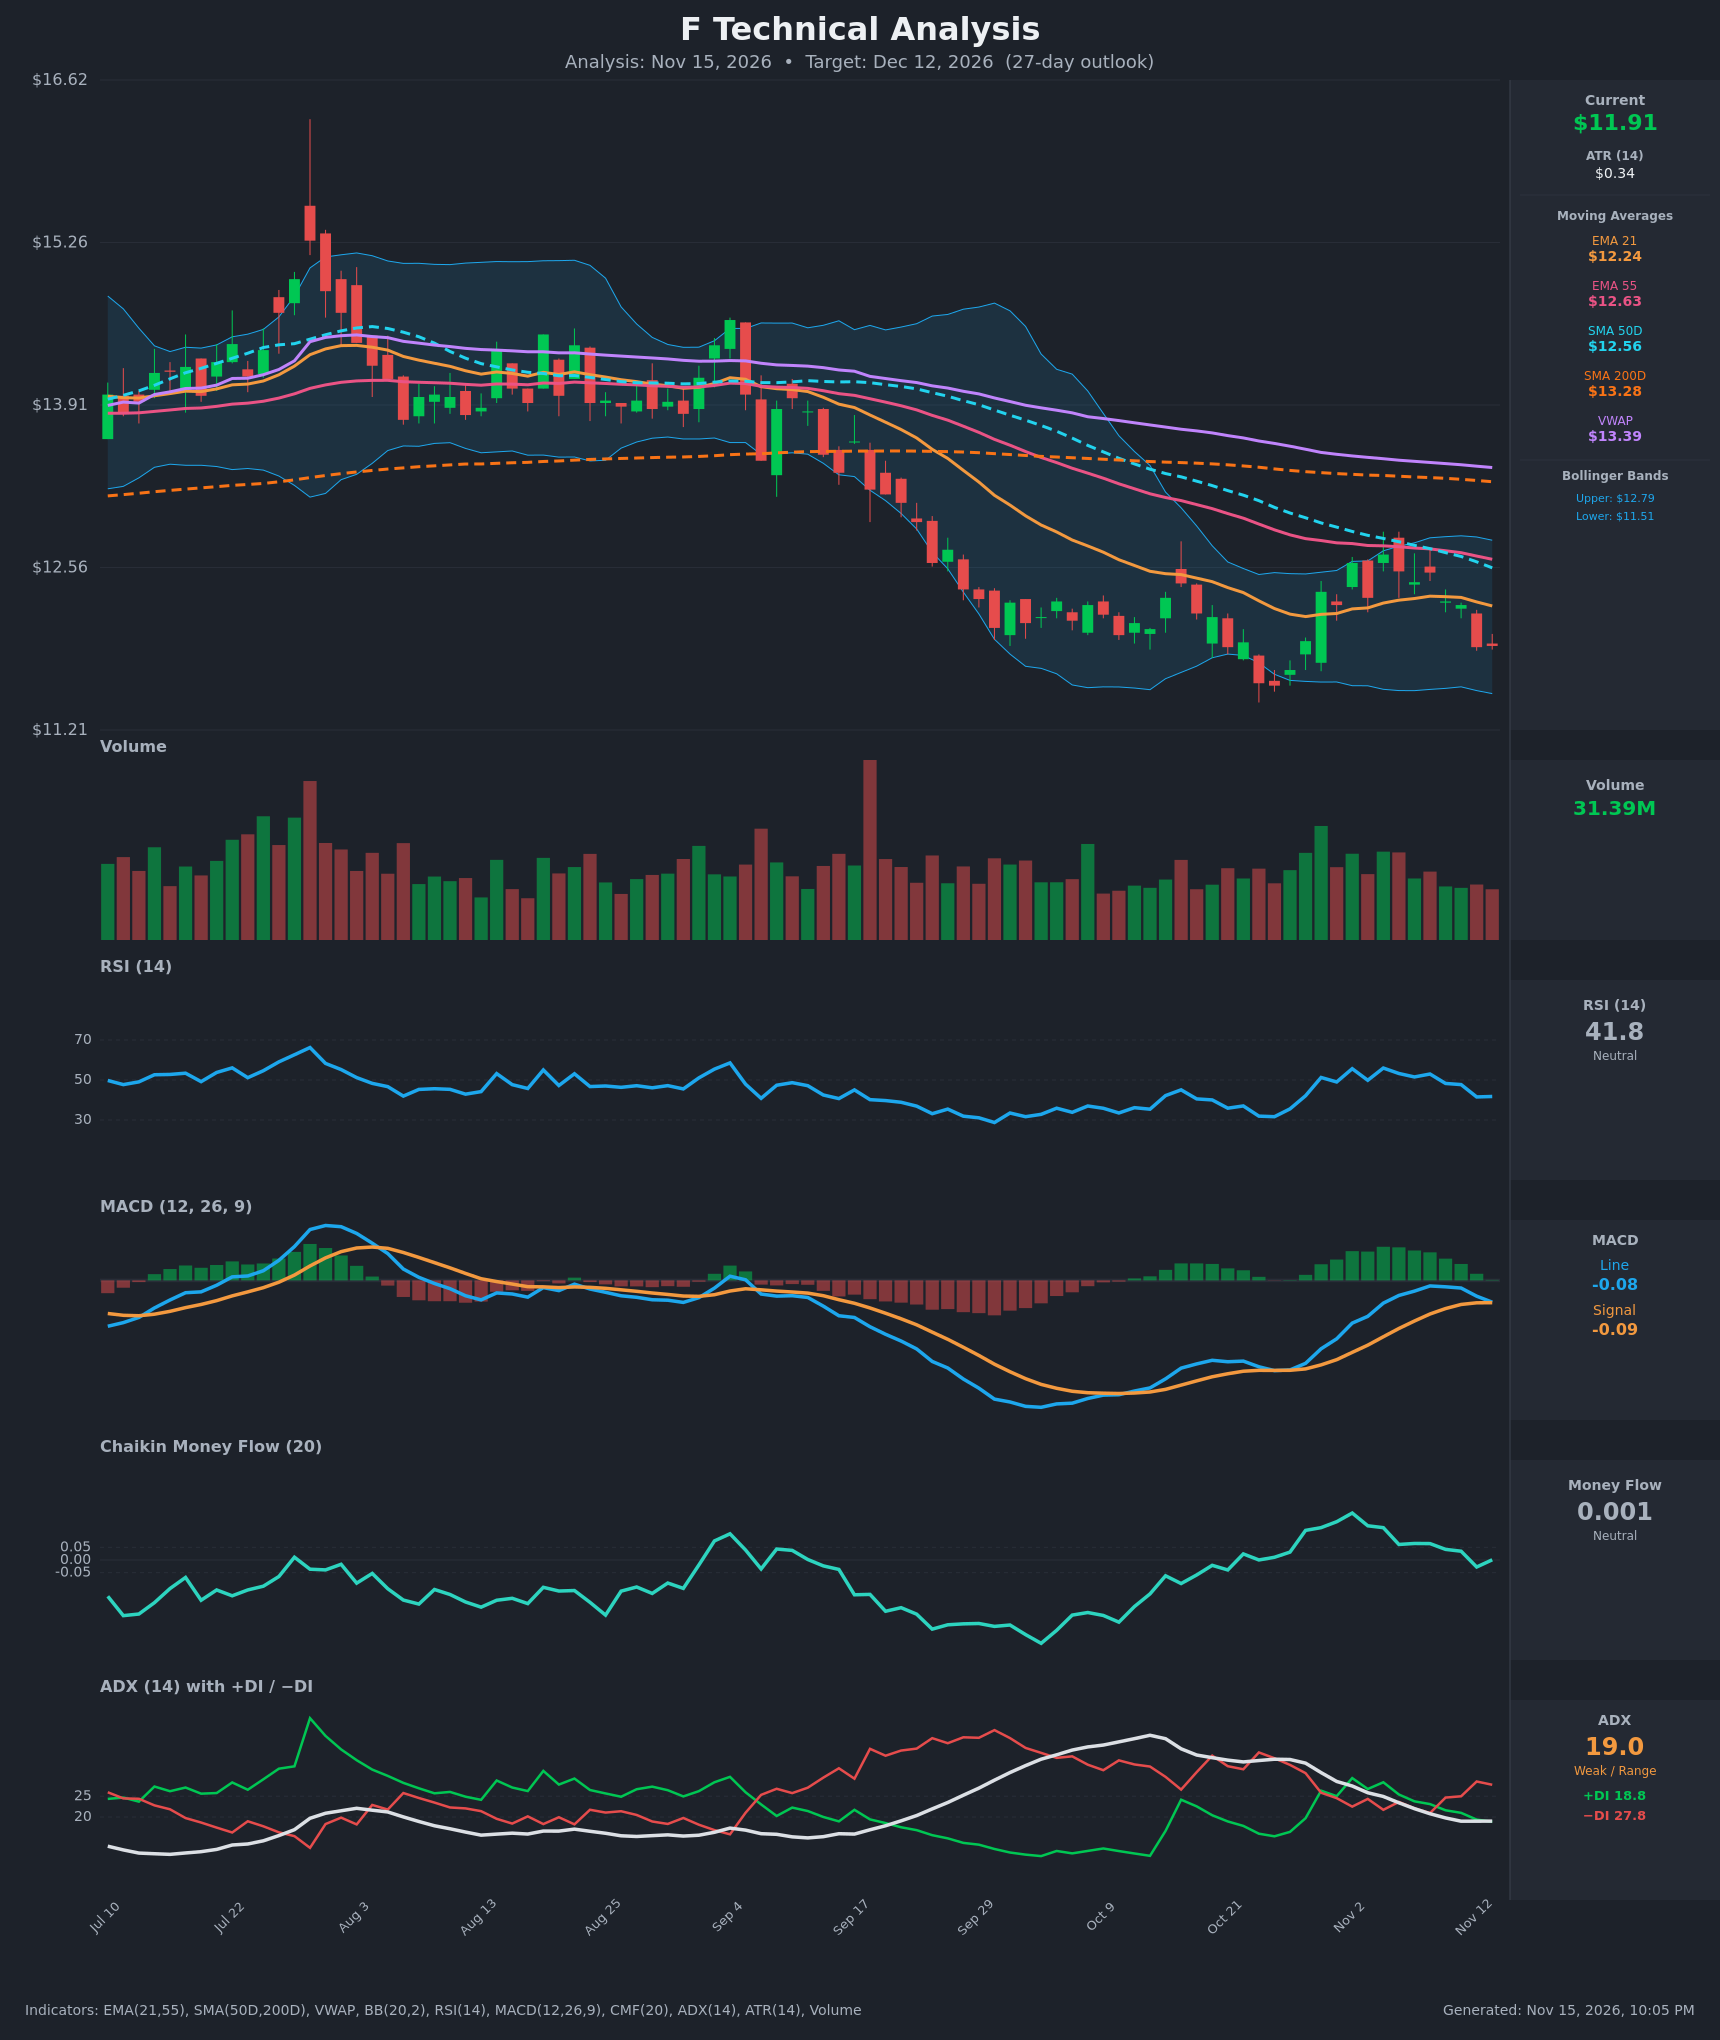
Analysis
TECHNICAL INDICATORS
- RSI (14): 41.76, down from the 56 peak on Nov 4 and from 47.7 yesterday. Momentum has rolled over below the 50 midline, but it is not yet oversold (<30). The lower-high sequence in RSI (66 → 56 → 56 → 41.8) shows fading buying strength. [Bearish]
- 20 EMA: The EMA 21 is $12.24 and price ($11.91) is below it, so it acts as resistance. The EMA 21 is also below the EMA 55 ($12.63), a bearish stack, and it has started to roll over (12.32 → 12.24). [Bearish]
- MACD: Line -0.084 and signal -0.086, with a histogram of about +0.002 that has shrunk from +0.13 in early November. The line has fallen from -0.021 to -0.084 in four sessions and is on the verge of a bearish crossover below the signal. Both lines are still below zero. [Bearish]
- Bollinger Bands (20): Upper $12.79, lower $11.51, midline about $12.15. Price is in the lower third of the band, about $0.40 above the lower band, after rejection near the midline/upper band in early November. The bands are narrow, which points to compression and a possible volatility expansion. A close below $11.51 would be a downside breakout. [Bearish]
- CMF (20): 0.001, inside the neutral ±0.05 band. It has faded from +0.19 (Nov 2) and briefly dipped negative (-0.028) on Nov 12. Buying pressure has dried up, but there is no clear distribution yet. [Neutral]
- ADX (14): 19.0, below 20, so the trend is weak or range-bound. −DI (27.8) is well above +DI (18.8), and the gap has widened over the last 4 bars. The ADX reading is not confirming a strong downtrend, but directional control sits with the bears. [Weak Trend, Bearish Direction]
- Volume: 31.39M, in line with recent average levels. The Nov 12 drop (-2.9%) came on solid volume, while the November rally attempts had no clear volume expansion. The long-term pattern is selling on the larger moves down. [Mildly Bearish]
DIVERGENCES & TRENDS
- Price is below the EMA 21 ($12.24), EMA 55 ($12.63), SMA 50 ($12.56), SMA 200 ($13.28) and VWAP ($13.39), a fully bearish alignment.
- The SMA 50 ($12.56) is already well below the SMA 200 ($13.28). That death cross is established, and the SMA 50 is declining toward the price.
- The SMA 50 and EMA 55 are converging near $12.56–12.63, which creates a dense resistance zone overhead.
- The October low (~$11.4) did hold. RSI made a higher low versus the late-September low (~29 → ~31 in October), which is a mild bullish divergence from the longer-term view. The recent RSI and MACD roll-over has weakened it.
- The −DI/+DI crossover on Nov 10 turned directional control back to the bears. The prior +DI > −DI period (Oct 29–Nov 9) failed to push price through $12.67.
- MACD momentum has peaked and is converging on the signal line, so a bearish cross looks imminent.
CHART PATTERNS
- Descending trend / lower highs: Since the September breakdown, price has made a series of lower highs and has been held under the declining EMA 55 and SMA 50. The structure resembles a Bearish Flag or Bearish Pennant consolidation after the sharp August–October decline.
- Double-top-like rejection: Highs at ~$12.60–12.67 (Nov 2 and Nov 4) failed near the SMA 50/EMA 55 zone. This resembles a Bearish Double Top, with neckline support around $12.25 now broken by the Nov 12 close.
- Range base: The $11.40–$12.70 range has held for about 6 weeks. A break of $11.40 would target a measured move toward roughly $10.80–$11.00, the range height projected downward.
- Counter-view: A Bullish Double Bottom is possible if the ~$11.40 area holds again, but it needs a close above the $12.67 neckline to confirm.
POTENTIAL SCENARIOS
- Scenario 1: Bearish Retest and Breakdown — Price fails at the EMA 21 and drifts down toward the October low as MACD crosses bearish and −DI stays dominant. A close below the lower band and support leads to an extension lower. Trigger: MACD bearish cross and a daily close below $11.50. Target: $11.55 at the 27-day mark, with an extended low near $10.90. Invalidation: daily close above $12.30 (EMA 21). (50% probability)
- Scenario 2: Neutral Range Chop — With ADX below 20 and neutral CMF, price oscillates between ~$11.40 and ~$12.40, holding the October low. Trigger: repeated defense of $11.40–11.50 with a failure at the EMA 21. Target: $11.80–$12.10. Invalidation: close below $11.35 or above $12.70. (20% probability)
- Scenario 3: Bullish Double-Bottom Bounce — Buyers defend the October low, RSI turns up from the low 40s, and price reclaims the EMA 21 and then the $12.60 SMA 50/EMA 55 cluster. Trigger: close above $12.30 on rising volume with CMF above +0.05. Target: $12.65–$12.80 (upper band). Invalidation: close below $11.40. (30% probability)
PRICE TARGETS
- Target Price: $11.55 (27 days, December 12, 2026)
- Expected Range: $10.85 to $12.60 (width $1.75, about 14.7% of the current price, consistent with the 27-day guidance of ~12–18%)
- Key Levels: Support at $11.40 (October low and lower band area), Resistance at $12.24 (EMA 21, with the SMA 50/EMA 55 cluster at $12.56–$12.63 above)
OVERALL BIAS
OVERALL BIAS: BEARISH - Price is below every major moving average, −DI dominates +DI, and RSI and MACD are rolling over with a bearish MACD crossover imminent. The failed rally at the SMA 50/EMA 55 zone favors a retest of the $11.40 low, though weak ADX (19) and the October double-bottom potential keep conviction modest.
This is educational analysis and not financial advice.