F 62-day bearish forecast — Nov 15, 2026
- Bias: Bearish
- Timeframe: 62 days (made Nov 15, 2026, target date Jan 15, 2027)
- Price at analysis: $11.91
- Price target: $11.45
- Expected range: $10.70 – $12.90
- Result: Pending — graded after the close on Jan 15, 2027
Get a free AI analysis of F today
Analysis
TECHNICAL INDICATORS
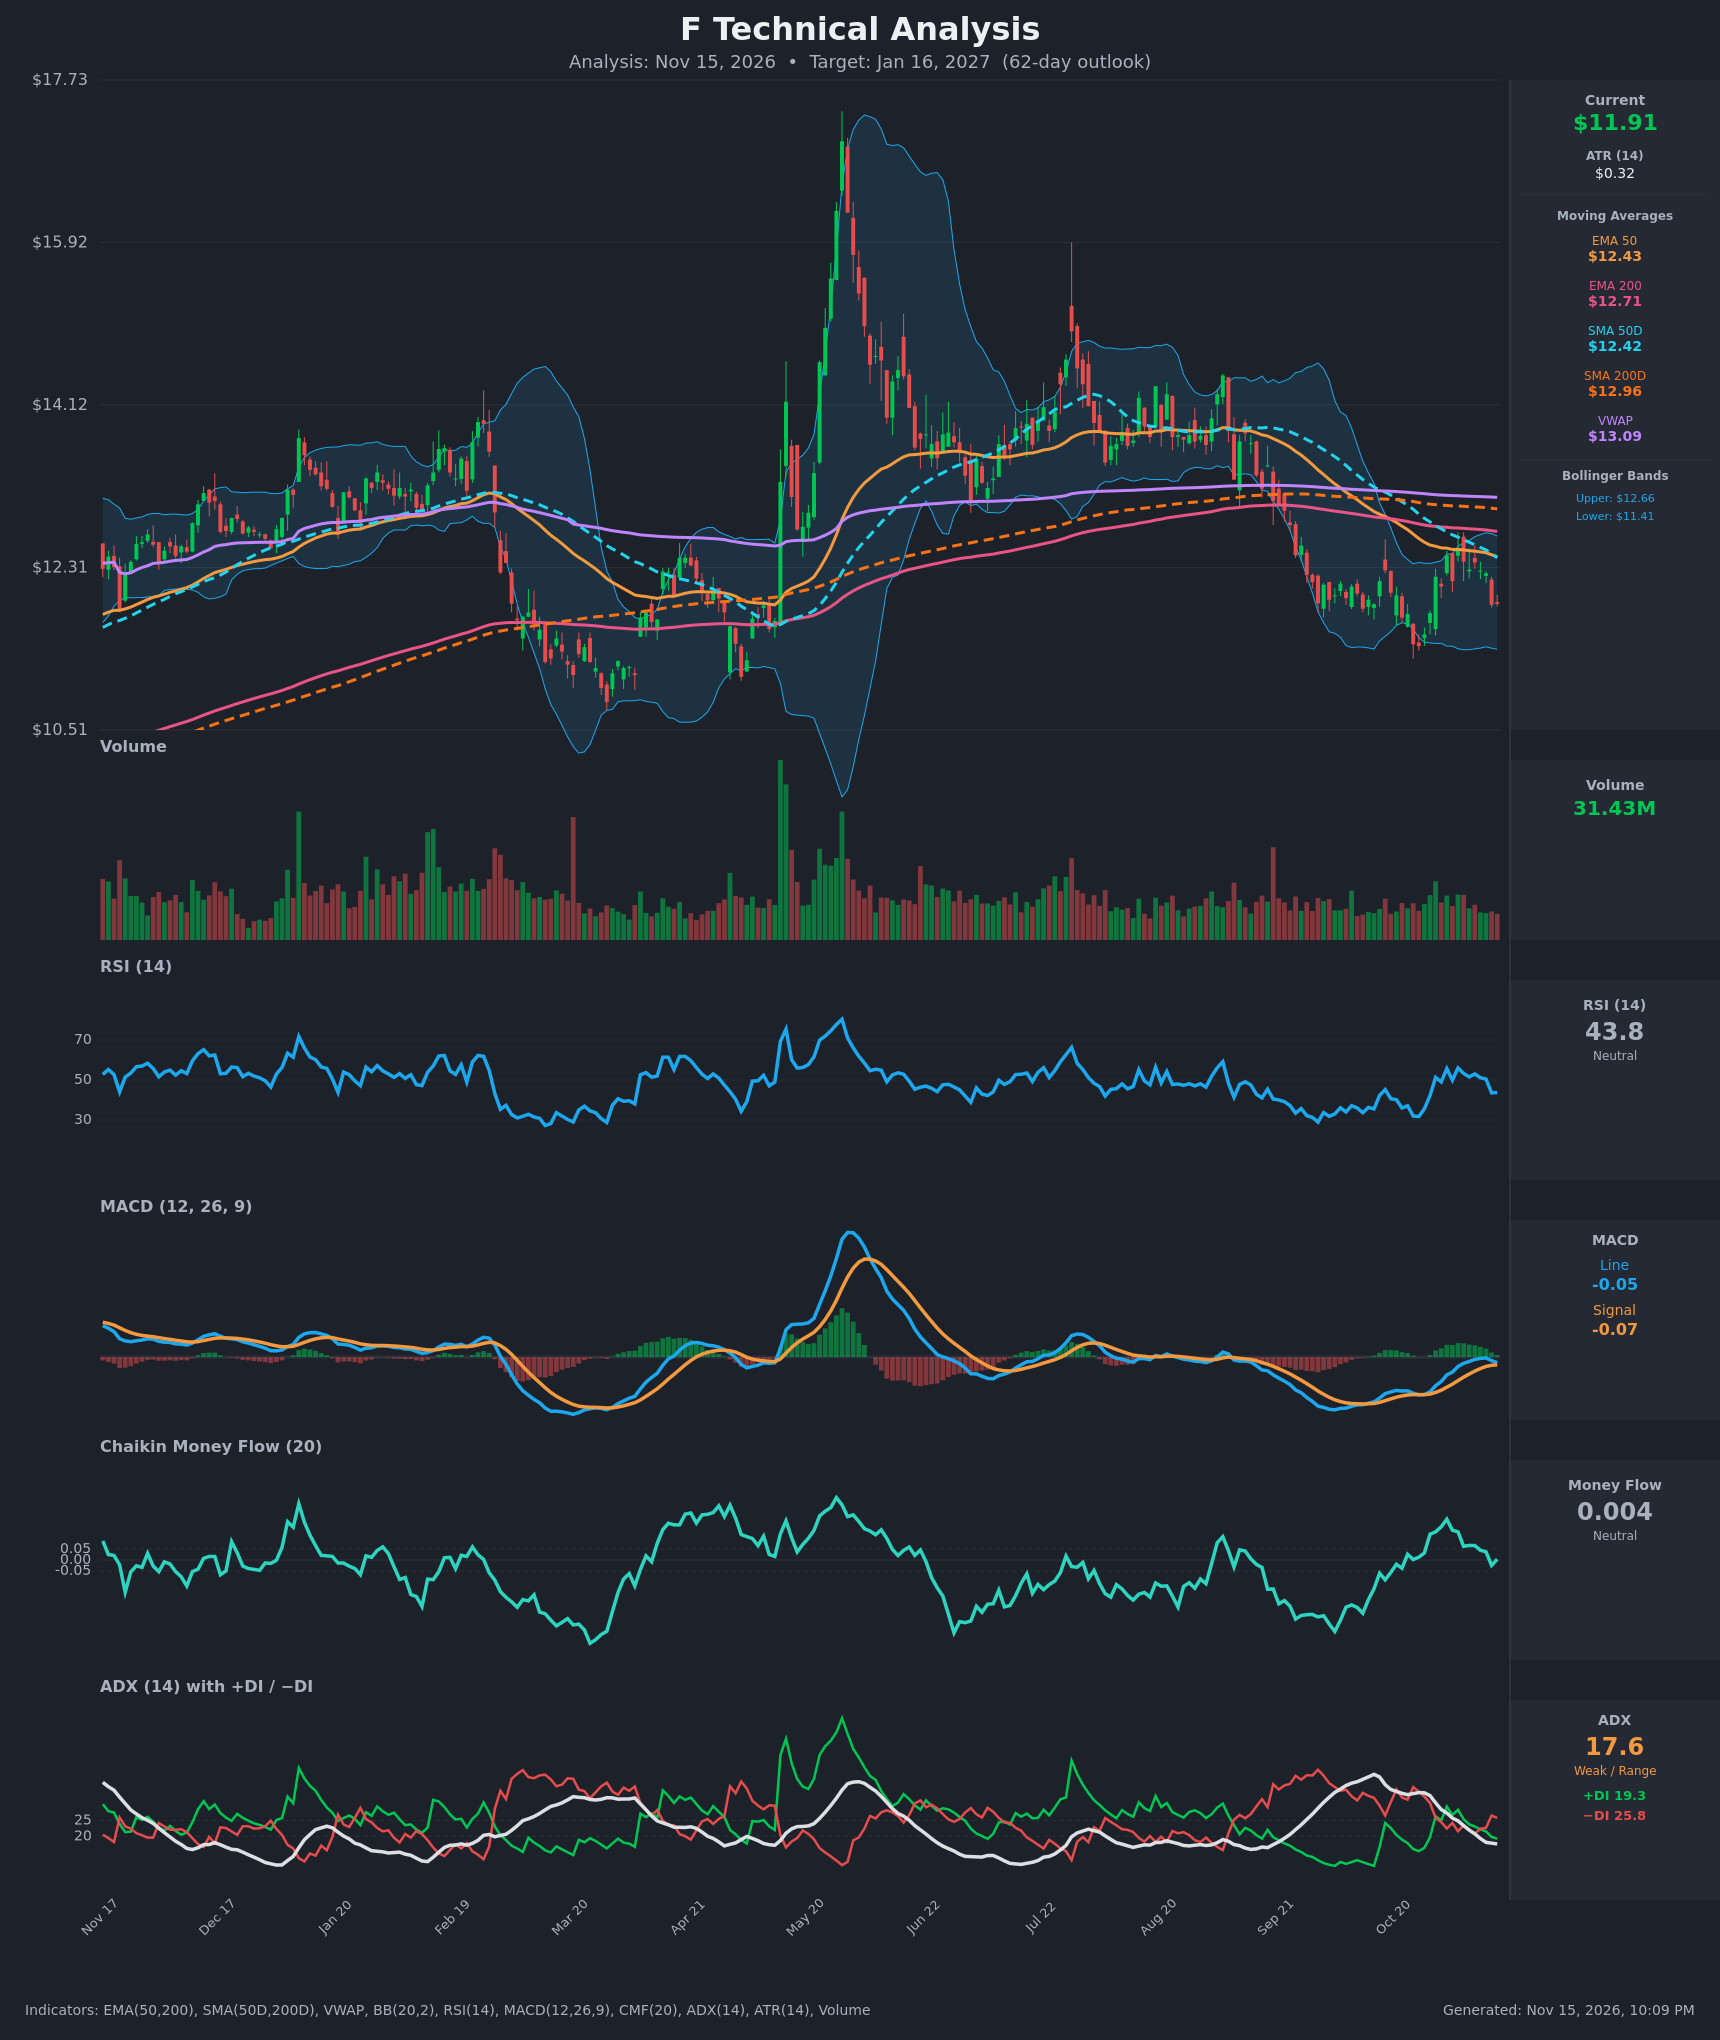
- RSI (14): 43.78, down from 50-56 earlier in November and below the 50 midline. Momentum is fading but not oversold (the Oct 26 low was 31.7), so there is room to fall before reaching a washout. [Bearish]
- 20 EMA: Not supplied. Using the 20-period Bollinger midline (about $12.03) as a proxy, price at $11.91 sits just below it, and it acts as near-term resistance. Price is also below EMA50 ($12.43), EMA200 ($12.71), SMA50D ($12.42), SMA200D ($12.96) and VWAP ($13.09). Every average sits overhead and is falling. [Bearish]
- MACD: Line -0.050, signal -0.069, histogram about +0.019. The line is still marginally above the signal, but the histogram has shrunk from +0.077 on Nov 11, and both lines are sloping down below zero. A bearish re-cross is imminent. [Bearish]
- Bollinger Bands (20): Upper $12.66, lower $11.41, so the bands are about $1.26 wide, a moderate squeeze after the October sell-off. Price is in the lower half, about $0.50 above the lower band, after being rejected near $12.50 earlier this month. [Neutral]
- CMF (20): 0.004, inside the ±0.05 neutral zone. It has slipped from 0.187 on Nov 2 and briefly went negative (-0.025) on Nov 12. Buyers are no longer pressing, but there is no clear distribution either. [Neutral]
- ADX (14): 17.6 with +DI 19.3 and −DI 25.8. ADX has fallen from 33.8 to below 20, so the October downtrend has lost strength and the market is range-like. −DI is back above +DI after a brief bullish flip, so the directional edge is with sellers. [Weak Trend, Bearish lean]
- Volume: 31.43M, average to below average, with no expansion on the bounce toward $12.50 and no capitulation spike on the October low. The bounce lacked conviction. [Neutral to mildly Bearish]
DIVERGENCES & TRENDS
- Divergences: There is no meaningful price/indicator divergence. RSI rose from 31.7 to the 50s on the bounce and is now rolling back down, which confirms the move rather than diverging from it.
- Moving-average structure: SMA50D ($12.42) is below SMA200D ($12.96), and EMA50 ($12.43) is below EMA200 ($12.71). The death-cross configuration is already in place, and the gaps are widening slightly. Price is below the 200-day on both measures, a long-term downtrend structure.
- Momentum: The MACD histogram is fading, with the signal line about to cross back above the MACD line. RSI is losing the 50 level. DI has flipped back to −DI over +DI.
- Trend strength: ADX has dropped from the low 30s to 17.6. The decline from about $14 has stalled into a base or range between roughly $11.40 and $12.50.
- Rejection: The bounce failed at the declining EMA50/SMA50 cluster (about $12.42-$12.52), which confirms overhead supply.
CHART PATTERNS
- Primary read, a bearish consolidation after a downtrend: The range of about $11.40-$12.50 since late October resembles a Bearish Flag/Pennant (continuation) or a rectangle. It is not tight enough to be a clean pennant. A breakdown below $11.40 projects the prior leg lower, roughly toward $10.80-$11.00. That is also the March-April low area and the measured move from the range height (about $1.10).
- Alternate read, a Bullish Double Bottom: The late-October low of about $11.44 and a retest near $11.40 could form a double bottom if $11.40 holds. Confirmation requires a close above about $12.52 on rising volume, which would target about $13.0 (SMA200D/VWAP). Volume and ADX do not currently support this.
- The lower highs on the bounce, combined with the declining moving averages, favor the bearish continuation read, though conviction is modest.
POTENTIAL SCENARIOS
- Scenario 1: Bearish Range Breakdown — Price fails at the $12.0-$12.4 resistance zone, the MACD re-crosses down, and the $11.40 support (October low, lower Bollinger Band) gives way. Trigger: daily close below $11.40 on above-average volume. Target: $10.80-$11.10. Invalidation: daily close above $12.55 (above EMA50/SMA50). (45% probability)
- Scenario 2: Neutral Range Chop — Price oscillates between $11.40 support and $12.45 resistance as ADX stays below 20, ending the period around $11.60-$12.30. Trigger: repeated defense of $11.40 and rejection near $12.4. Target: $11.70-$12.20. Invalidation: a close outside $11.35-$12.55. (30% probability)
- Scenario 3: Bullish Double-Bottom Recovery — Buyers defend $11.40, CMF turns above +0.05, and price reclaims the EMA50/SMA50 cluster. Trigger: close above $12.55 with expanding volume and a MACD cross above zero. Target: $12.95-$13.10 (SMA200D/VWAP). Invalidation: close back below $11.90 after the breakout. (25% probability)
PRICE TARGETS
- Target Price: $11.45 (62 days, around Jan 16, 2027)
- Expected Range: $10.70 to $12.90. Width is $2.20, about 18.5% of the current price, which fits the 61-180 day guidance.
- Key Levels: Support at $11.40, Resistance at $12.45
OVERALL BIAS
OVERALL BIAS: BEARISH - Price is below every major moving average with a death-cross structure in place. −DI is above +DI, MACD momentum is fading, and the bounce was rejected at the EMA50/SMA50 cluster on unconvincing volume. The weak ADX and neutral CMF keep conviction modest, and a defense of $11.40 would shift the outlook toward a range.
This is educational analysis and not financial advice.