F 83-day bearish forecast — Nov 15, 2026
- Bias: Bearish
- Timeframe: 83 days (made Nov 15, 2026, target date Feb 5, 2027)
- Price at analysis: $11.91
- Price target: $11.35
- Expected range: $10.35 – $12.90
- Result: Pending — graded after the close on Feb 5, 2027
Get a free AI analysis of F today
Analysis
TECHNICAL INDICATORS
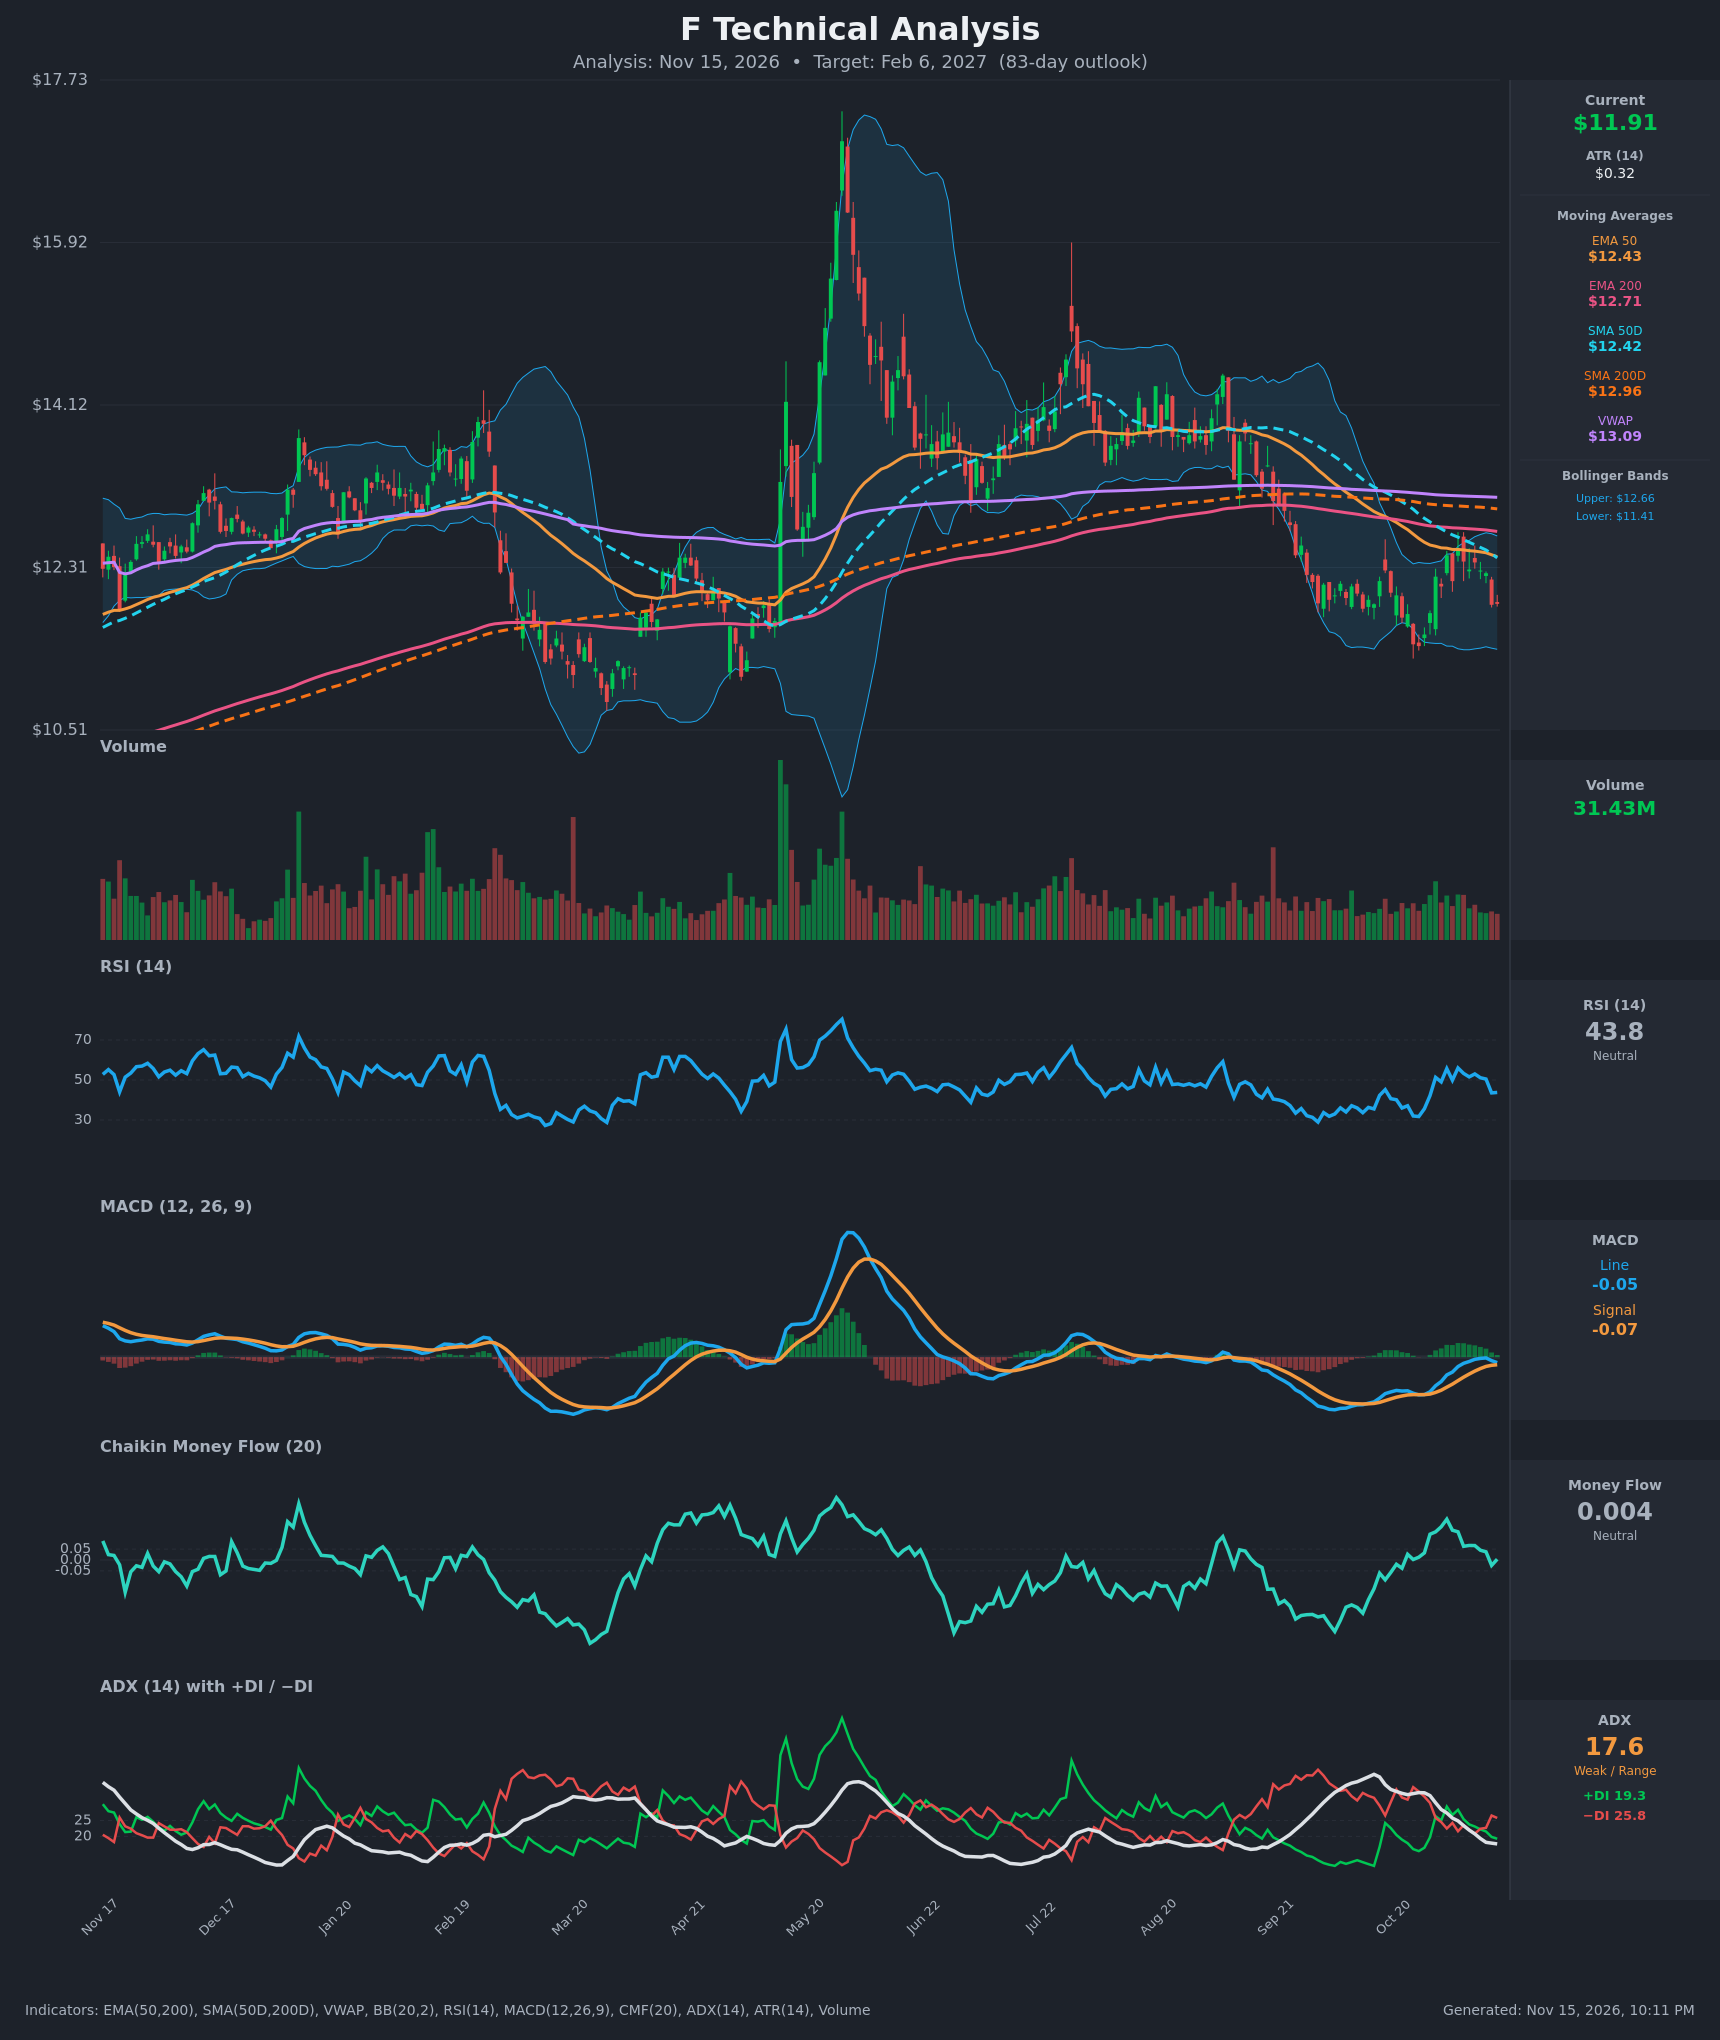
- RSI (14): 43.78, down from 56 on Nov 4 and from 50.5 on Nov 11. It is below the 50 midline and rolling over, but not oversold, so there is room for more downside before a momentum low. [Bearish]
- 20 EMA: Not supplied. The EMA 50 ($12.43) is the nearest reference, and price at $11.91 sits about 4% below it. The EMA 50 has declined for 15 straight bars and acts as overhead resistance. [Bearish]
- MACD: Line -0.050 vs signal -0.069, so the histogram is a slim +0.019. The histogram was about +0.041 two bars ago, and the line is rolling down toward the signal. A bearish crossover looks imminent, with both lines below zero. [Bearish]
- Bollinger Bands (20): Upper $12.66, lower $11.41, midline about $12.03. Price is below the midline in the lower half of the band, about $0.50 above the lower band. The bands are fairly narrow, so a volatility expansion is likely. Direction favors the lower half. [Bearish]
- CMF (20): 0.004, within ±0.05, after fading from 0.187 on Nov 2 and briefly turning negative (-0.025) on Nov 12. Buying pressure has evaporated but there is no sustained distribution yet. [Neutral]
- ADX (14): 17.6 and falling (from 33.8 on Oct 26), so there is no strong trend. −DI (25.8) is above +DI (19.3), so bears have the edge. The market is range-like with a bearish tilt. [Weak Trend, Bearish lean]
- Volume: 31.43M, roughly average with no spike. The Nov 12 drop to $11.90 came on moderate volume. The October bounce had no strong volume follow-through. [Neutral / no conviction]
DIVERGENCES & TRENDS
- Moving average structure is bearish. Price ($11.91) is below the EMA 50 ($12.43), EMA 200 ($12.71), SMA 50 ($12.42), SMA 200 ($12.96) and VWAP ($13.09). The SMA 50 is below the SMA 200 (death cross in place) and the EMA 50 is below the EMA 200, so the longer-term trend is down.
- No clean divergence. RSI and MACD are making a lower high within the recent bounce (RSI 56 to 43.8) while price failed near $12.50. This is mild bearish confirmation, not a divergence.
- ADX is fading. The early-Nov sell-off trend (ADX 33.8) has dissipated. The DI lines crossed back to −DI dominance on Nov 12, which is a bearish crossover.
- Momentum is rolling over. MACD is converging on its signal line, and RSI has dropped from 56 to 43.8 in under 10 sessions.
- Failed rally. The bounce from about $11.40 stalled just under the $12.50 cluster of EMA 50 and SMA 50, a classic resistance rejection.
CHART PATTERNS
- Bearish flag / pennant-type consolidation. After the Sep–Oct drop from about $13.8 to $11.4, price has formed a small range of roughly $11.4 to $12.5. A break below $11.40 would project a measured move toward $10.5 to $10.9, which matches the March lows.
- Lower highs under falling averages. The Aug peak of about $14.2 is followed by lower highs, consistent with a broader downtrend. The $11.40 level is the key double-bottom-style floor. A hold there with a break above $12.50 would instead give a bullish double-bottom/range-recovery read, but that is currently the less likely path.
- Weak ADX and the compressed bands point to a coil. Resolution is more likely down given the MA stack.
POTENTIAL SCENARIOS
- Scenario 1: Bearish Breakdown Below Range Floor — Price fails at the $12.40–12.50 moving-average cluster, MACD crosses below signal, and the $11.40 floor breaks, extending the downtrend. Trigger: daily close below $11.40 with MACD bearish cross and RSI below 40. Target: $10.70–$11.20, with a drift toward $11.30 by the 83-day mark. Invalidation: daily close above $12.65 (upper Bollinger Band and EMA 50 area). (50% probability)
- Scenario 2: Bullish Recovery Above Resistance — Buyers defend $11.40, CMF turns positive, and price reclaims the EMA 50/SMA 50 cluster, then challenges the SMA 200 and VWAP. Trigger: close above $12.65 on rising volume with RSI above 55. Target: $12.90–$13.10. Invalidation: close below $11.40. (30% probability)
- Scenario 3: Neutral Range Chop — Price oscillates between $11.40 and $12.50 as ADX stays under 20. Trigger: repeated failures at both range edges. Target: $11.80–$12.20. Invalidation: a decisive close outside the $11.40–$12.50 range. (20% probability)
PRICE TARGETS
- Target Price: $11.35 (83-day horizon, about -4.7% from $11.91)
- Expected Range: $10.35 to $12.90 (width $2.55, about 21.4% of current price, consistent with the 61–180 day guidance of 18–30%)
- Key Levels: Support at $11.40, Resistance at $12.43
OVERALL BIAS
OVERALL BIAS: BEARISH - Price is below every major moving average and VWAP, the SMA 50 is below the SMA 200 (death cross), and −DI leads +DI. MACD is on the verge of a bearish crossover while RSI rolls over, and the bounce stalled under the $12.43–12.50 resistance cluster. A break of the $11.40 floor favors a drift toward the $10.7–$11.3 area.
This is educational analysis and not financial advice.