F 34-day bearish forecast — Nov 15, 2026
- Bias: Bearish
- Timeframe: 34 days (made Nov 15, 2026, target date Dec 18, 2026)
- Price at analysis: $11.91
- Price target: $11.45
- Expected range: $10.50 – $12.50
- Result: Pending — graded after the close on Dec 18, 2026
Get a free AI analysis of F today
Analysis
TECHNICAL INDICATORS
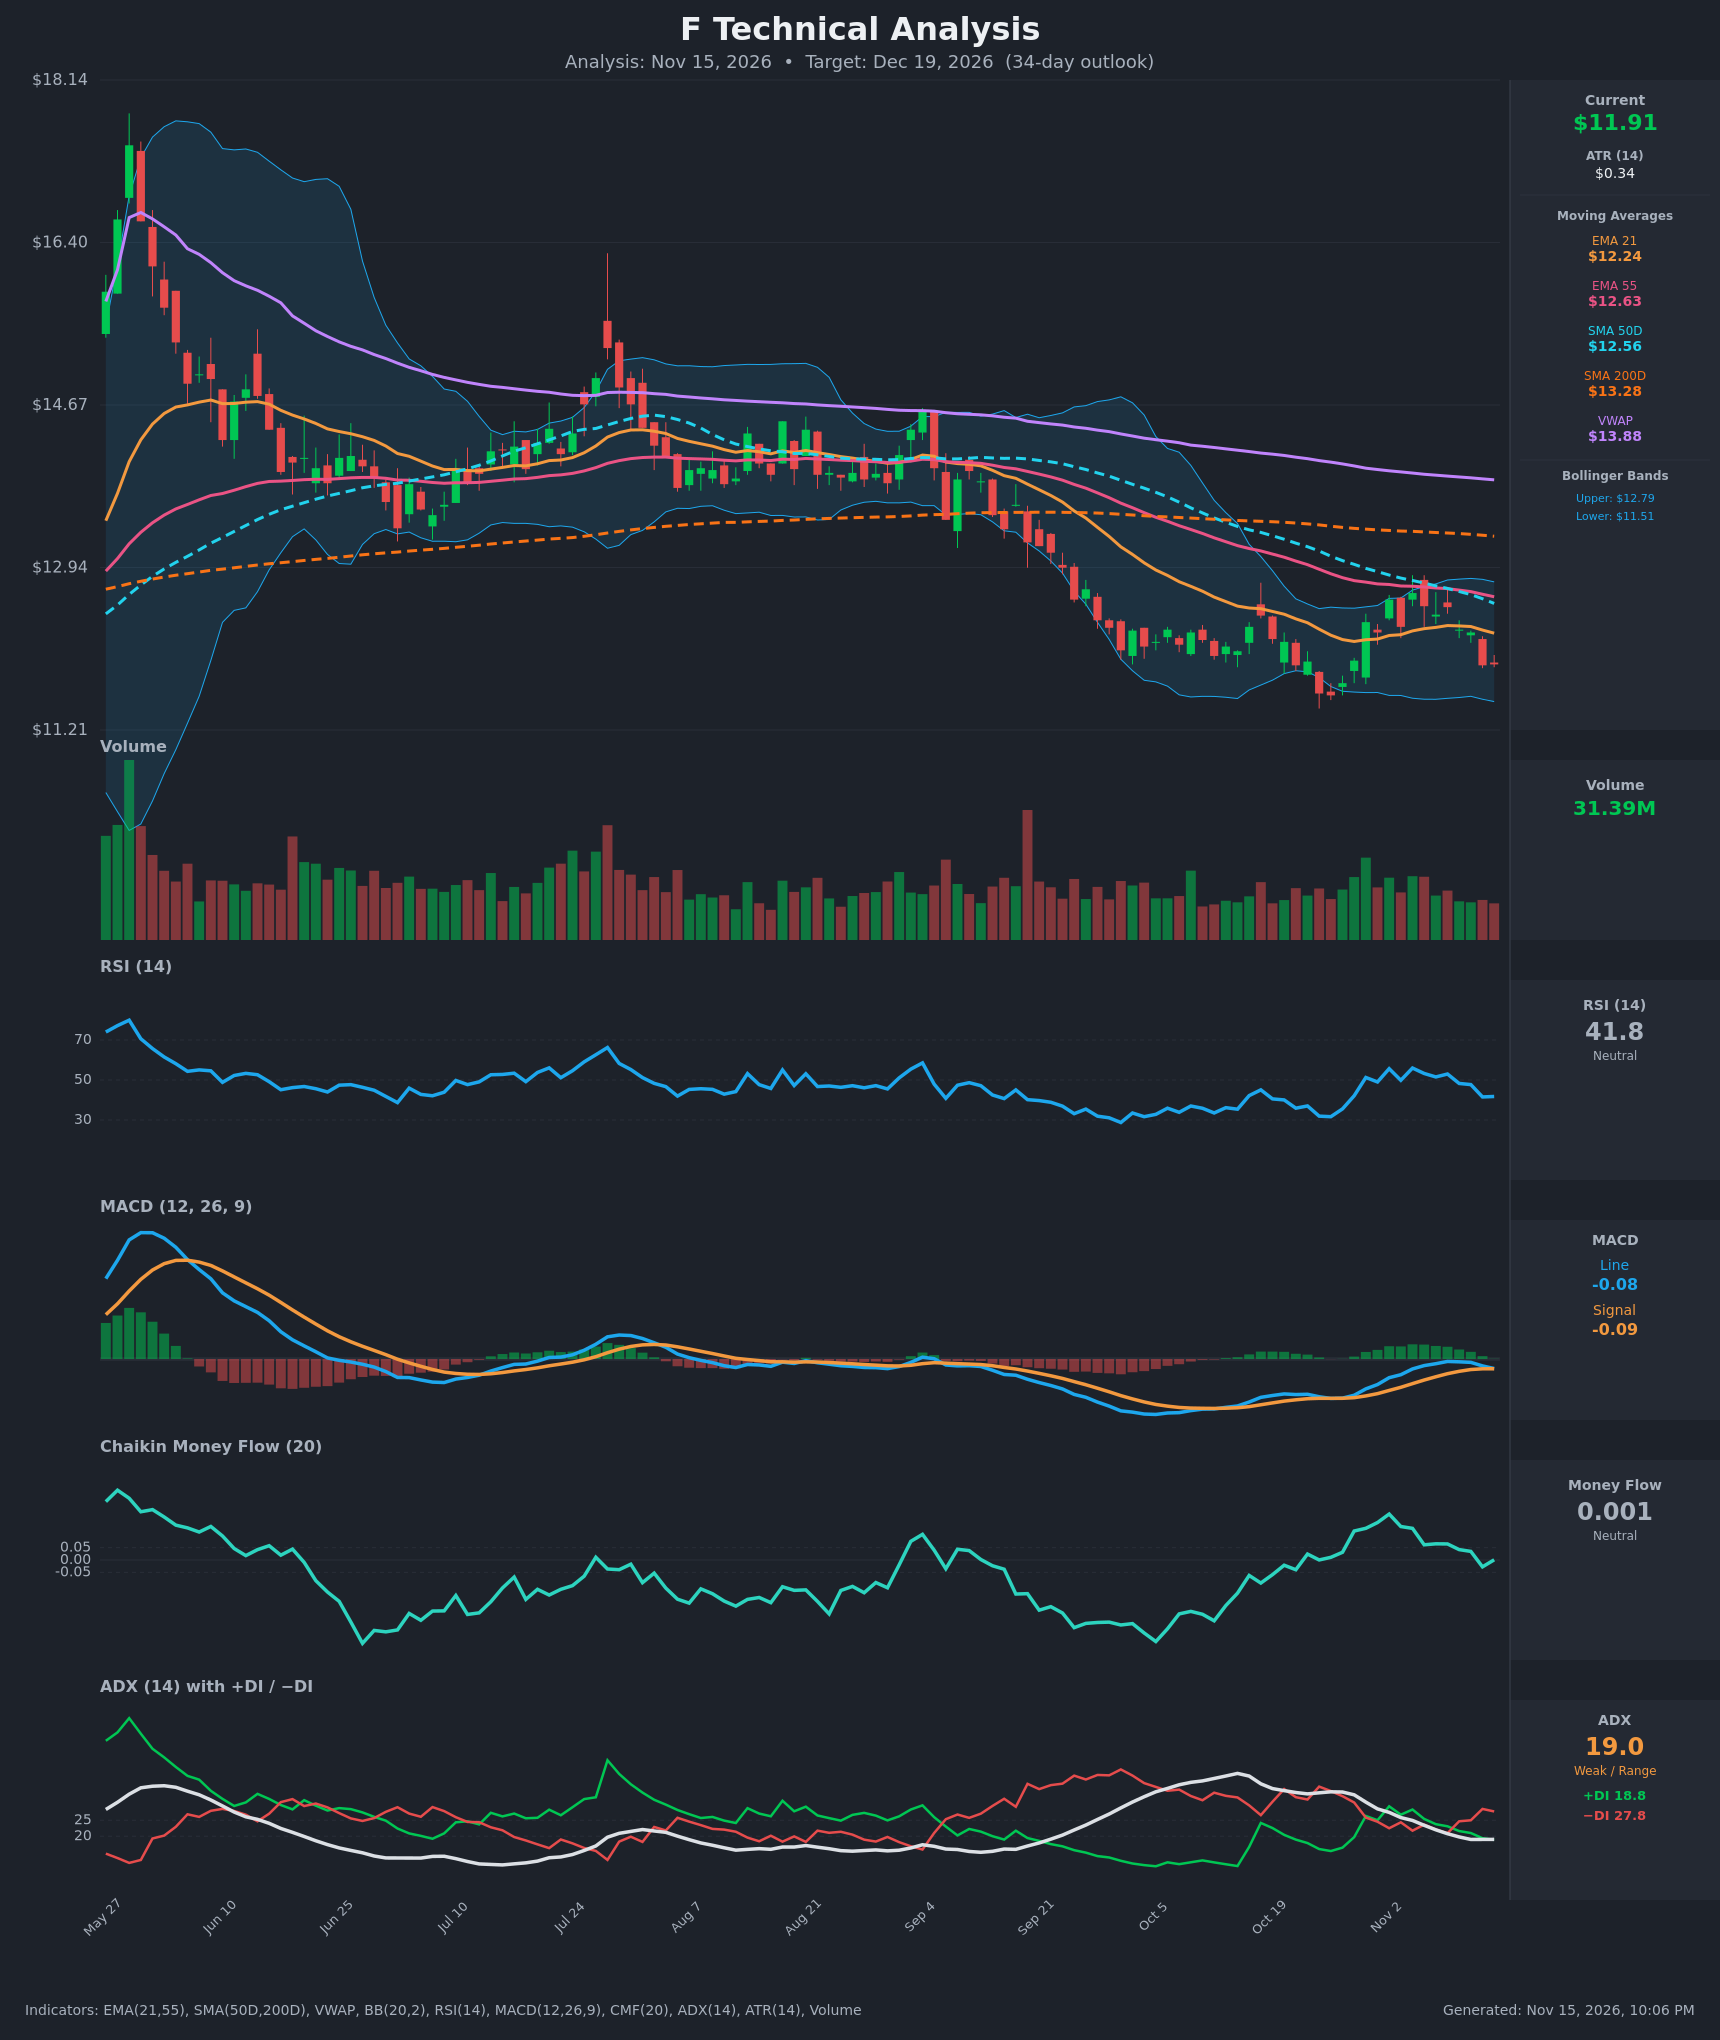
- RSI (14): 41.76, down from the mid-50s in early November (56 on Nov 4). It is below 50 but well above oversold (30), and momentum is turning lower again. [Bearish]
- 20 EMA: The 21 EMA is $12.24 and price at $11.91 is below it, so it acts as resistance. The EMA21 is also below the EMA55 ($12.63), which keeps the short-term structure bearish. [Bearish]
- MACD: Line at -0.084 vs. signal at -0.086, a marginal bullish position. But the line has rolled over from -0.021 and the histogram is fading toward zero (barely positive). The recent bullish recovery is stalling and a bearish cross looks likely. [Neutral]
- Bollinger Bands (20): Upper $12.79, lower $11.51, midline about $12.15. Price at $11.91 sits in the lower third of the bands, below the midline. The bands are fairly narrow, which suggests contained volatility, with room to test the lower band. [Bearish]
- CMF (20): 0.001, which is between ±0.05 and has faded from 0.186 on Nov 2. Buying pressure has dissipated and there is no accumulation. [Neutral]
- ADX (14): 19.0, which is weak or range-bound, and falling from 33.9. −DI (27.8) is above +DI (18.8) after a bearish DI crossover on Nov 10, so the bears hold a modest edge. [Weak Trend, Bearish lean]
- Volume: 31.39M, which is average to below average. The Nov 12 drop and the bounce off the lows both came on modest volume, so there is no strong conviction either way. [Neutral]
DIVERGENCES & TRENDS
- Price is below the SMA50D ($12.56), SMA200D ($13.28) and VWAP ($13.88). The long-term trend is clearly down.
- The SMA50D has been below the SMA200D (death cross) for some time. The gap is persistent, around $0.72.
- The EMA21 is below the EMA55 (bearish alignment). All the moving averages slope down.
- The late-Oct low near $11.58 was followed by a rally to about $12.67 (Nov 4), which was rejected at the falling SMA50D/EMA55 cluster. This is a lower high within the downtrend.
- There is no clear divergence. RSI made a higher low versus the early-Oct trough (about 30) but is now rolling over again. The earlier bullish MACD improvement has stalled.
- The DI crossover (−DI back above +DI) on Nov 10 and a drop in CMF to neutral confirm fading bullish momentum.
- ADX is falling below 20, so a range or slow-grind market is plausible. The $11.50 area is the key floor.
CHART PATTERNS
- Price has formed a base around $11.50–$12.70 since late October (roughly a double-bottom or range attempt). The $12.60–$12.70 neckline was rejected, which fits a failed Bullish Double Bottom attempt. A failed double bottom is bearish.
- A broader Descending Triangle-like structure appears. Lower highs (the declining MAs and the Nov 4 high) sit above a flat support zone near $11.50–$11.60. A break below would target roughly $10.70–$11.00, using the pattern height of about $1.1.
- An upside break above $12.70 would negate the pattern and open a move toward $13.30 (SMA200D).
POTENTIAL SCENARIOS
- Scenario 1: Bearish Breakdown of the Range Floor — Price is rejected under the EMA21/EMA55 and the DI spread stays in favor of the bears. Price retests $11.50 and breaks lower as MACD crosses down. Trigger: daily close below $11.50. Target: $10.90. Invalidation: close above $12.70. (45% probability)
- Scenario 2: Neutral Range Chop — ADX is below 20 and CMF is flat, so price oscillates between $11.50 and $12.50. Trigger: holds the $11.50 floor and fails at the EMA21. Target: $11.80–$12.20. Invalidation: close outside $11.40–$12.70. (30% probability)
- Scenario 3: Bullish Recovery to the SMAs — Price holds $11.50, MACD turns up, and it reclaims the EMA21 and then the SMA50D. Trigger: close above $12.30 with CMF above +0.05. Target: $12.80–$13.30. Invalidation: close below $11.50. (25% probability)
PRICE TARGETS
- Target Price: $11.45 (34-day)
- Expected Range: $10.50 to $12.50 (width $2.00, about 16.8% of current price, consistent with 30–60 day guidance of 12–18%)
- Key Levels: Support at $11.50, Resistance at $12.24
OVERALL BIAS
OVERALL BIAS: BEARISH - Price is below all key moving averages (EMA21, EMA55, SMA50D, SMA200D, VWAP) with −DI above +DI. The rebound was rejected at the falling SMA50D/EMA55 cluster, and MACD and CMF momentum has faded. A break of the $11.50 floor is more likely than a sustained recovery, although weak ADX limits conviction.
This is educational analysis and not financial advice.