F 20-day bearish forecast — Nov 15, 2026
- Bias: Bearish
- Timeframe: 20 days (made Nov 15, 2026, target date Dec 4, 2026)
- Price at analysis: $11.91
- Price target: $11.65
- Expected range: $11.05 – $12.25
- Result: Pending — graded after the close on Dec 4, 2026
Get a free AI analysis of F today
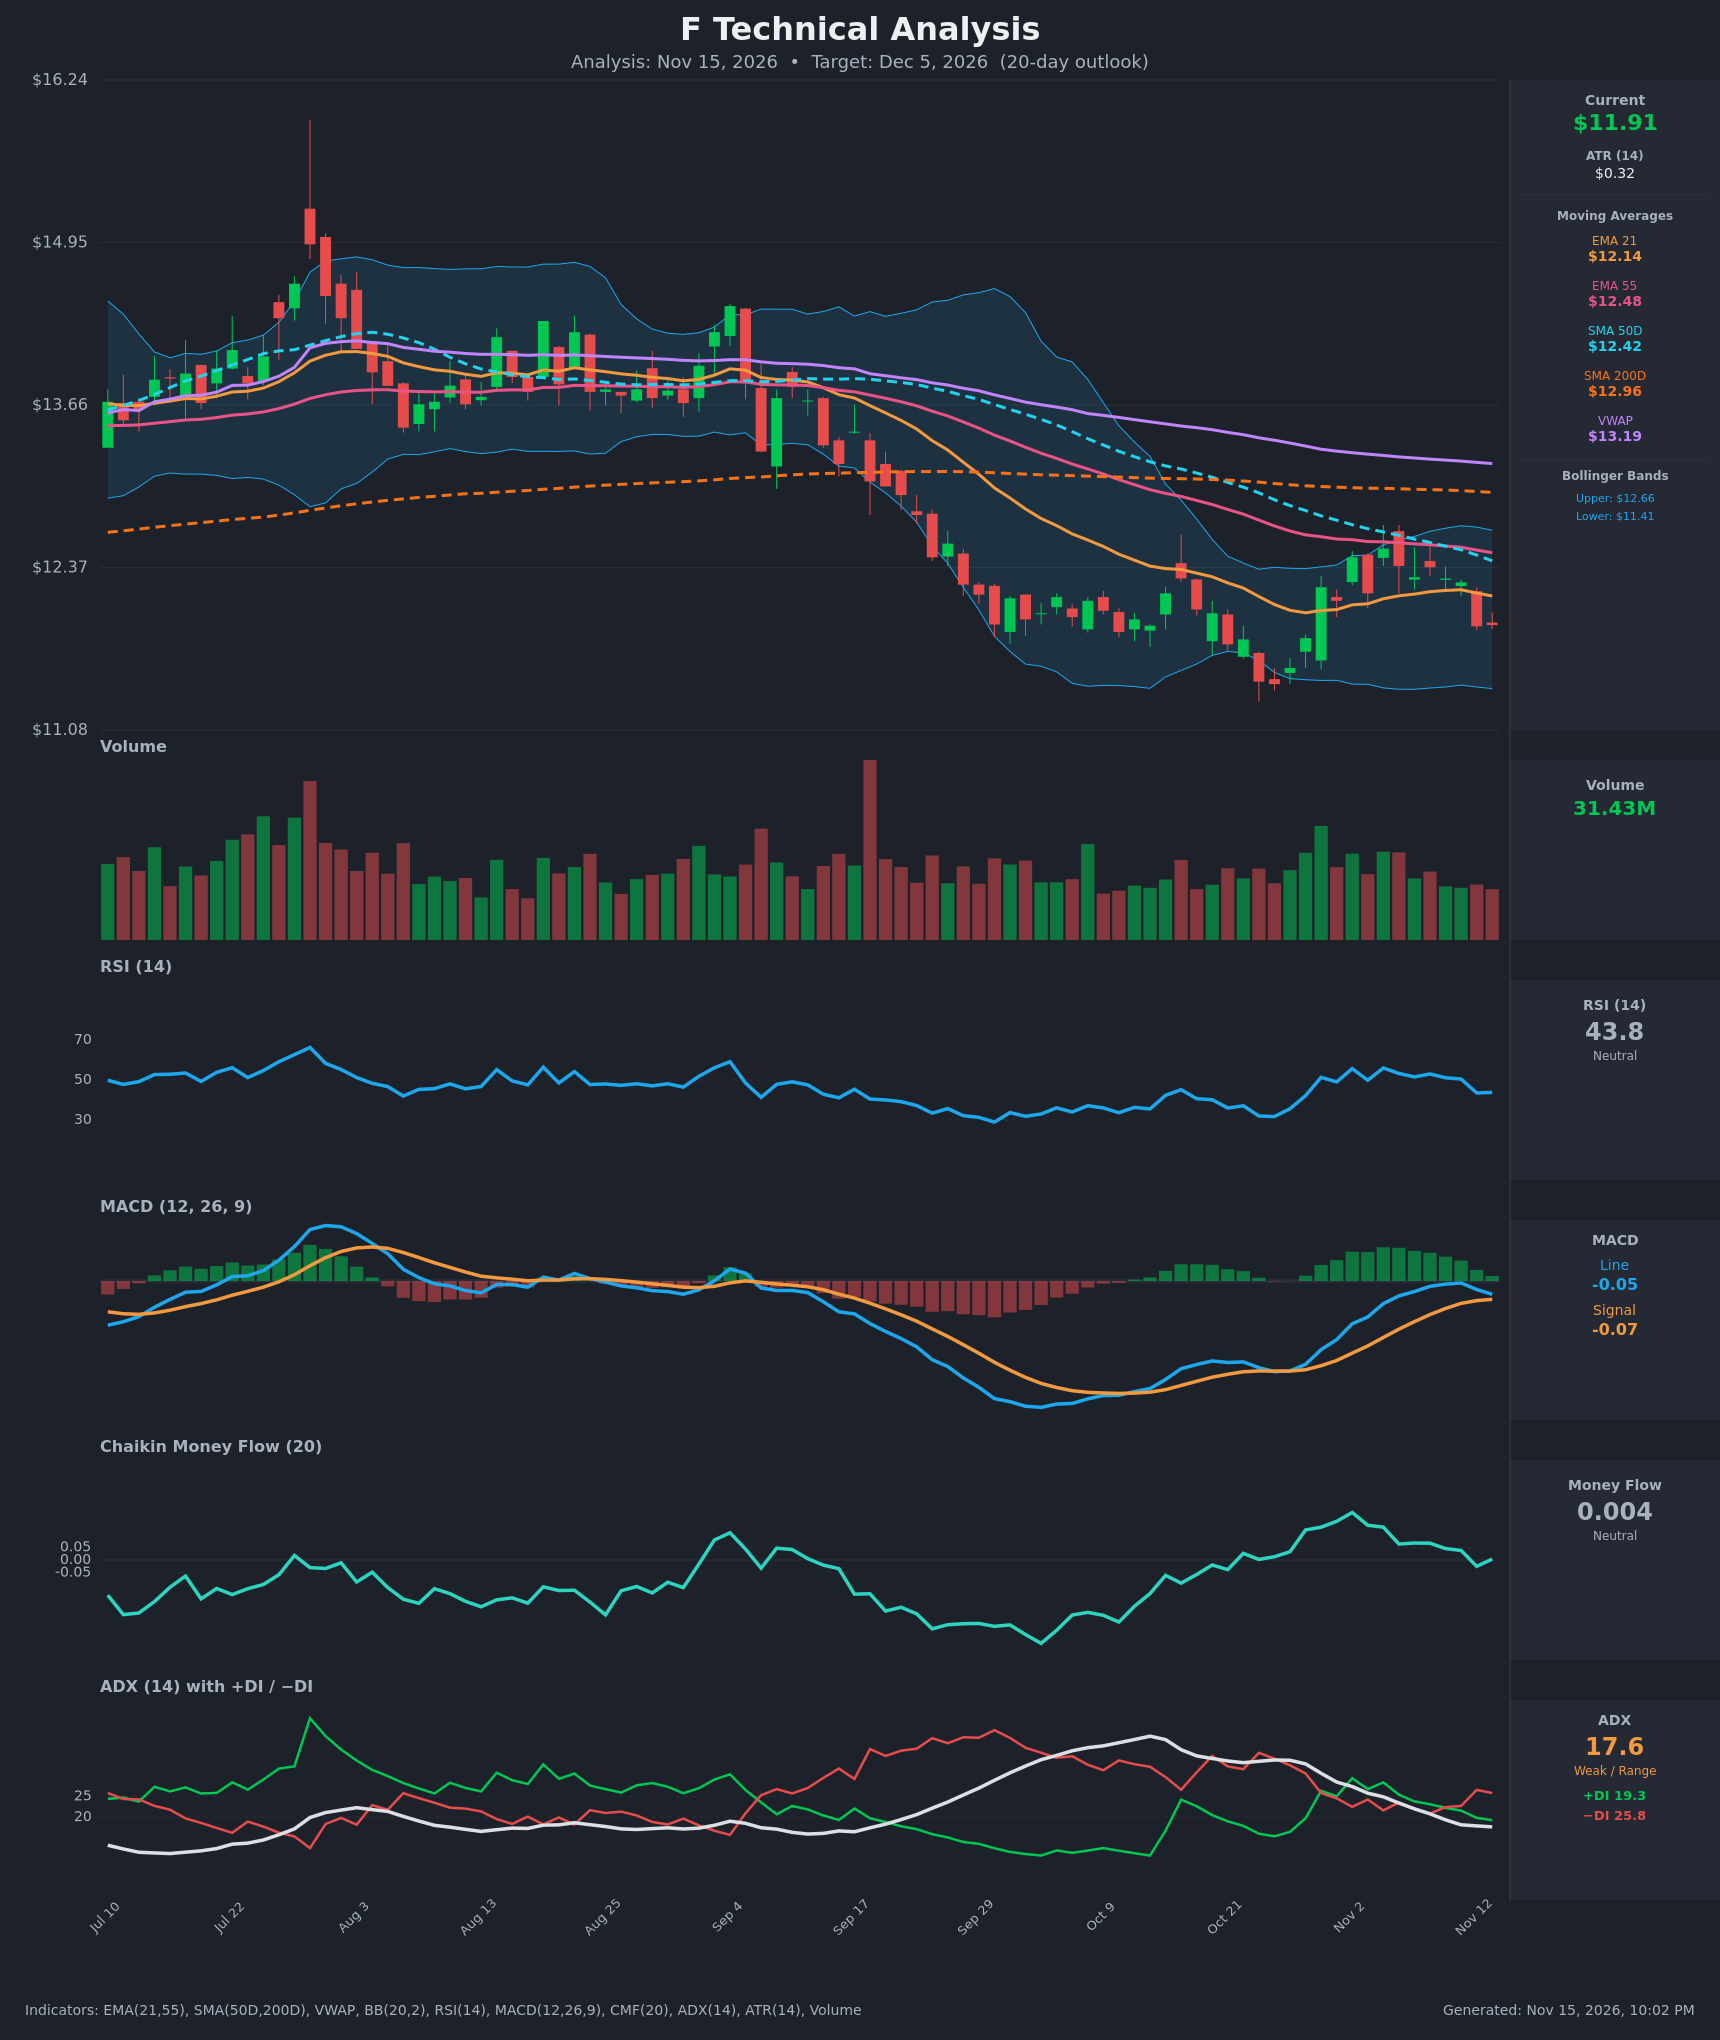
Analysis
TECHNICAL INDICATORS
- RSI (14): 43.78, down from the 56 peak on Nov 4 and now below the 50 midline. Momentum is fading but not oversold, which leaves room for more downside before the 30 zone. [Bearish]
- 20 EMA: The EMA 21 is $12.14 and price at $11.91 is below it, so it now acts as resistance. EMA 21 is also below EMA 55 ($12.48) with both sloping down, so the short-term trend is down. [Bearish]
- MACD: The line is -0.050 and the signal is -0.069, so the line is still marginally above the signal. The histogram is small and positive (about +0.019) and has shrunk from about +0.10 in early November. The line has rolled over from -0.007 and is converging on the signal, so a bearish crossover looks imminent. Both lines sit below zero. [Bearish]
- Bollinger Bands (20): The bands run $11.41 to $12.66, with the midline near $12.04. Price is in the lower half, below the midline, after being rejected near the upper band around Nov 4 ($12.52). The bands have narrowed from the late-October expansion, which points to range-type behavior. [Neutral]
- CMF (20): 0.004 sits inside the ±0.05 neutral zone. It has faded from +0.19 on Nov 2 and dipped negative (-0.025) on Nov 12, so buying pressure has evaporated. [Neutral]
- ADX (14): 17.6 and falling from 33.8 in late October, so the trend is weak and range-like. -DI (25.8) is above +DI (19.3), and the DI spread has been widening since Nov 10, so bears hold a slight edge. [Weak Trend, bearish lean]
- Volume: 31.43M, about average, with no surge on the Nov 12 breakdown candle. The October 29 and November 2 bounces came on solid volume but fizzled. The lack of follow-through volume shows weak conviction on both sides. [Neutral to slightly bearish]
DIVERGENCES & TRENDS
- Price is below the SMA 200D ($12.96), SMA 50D ($12.42), both EMAs and VWAP ($13.19), which is a structural downtrend. The SMA 50D is below the SMA 200D, so the death cross is already in place.
- The Oct 26 low ($11.44) was a momentum extreme (RSI 31.7, ADX 33.8 with -DI dominant). The bounce to $12.52 was a relief rally that lost steam at the SMA 50D and EMA 55 zone.
- There is no clear divergence. RSI and MACD made higher lows from late October, but that bullish momentum has now faded as price makes a lower high ($12.52 vs the earlier highs).
- Bearish signals include the Nov 12 drop below the EMA 21 (RSI from 50.5 to 43.5), -DI retaking the lead, CMF turning negative, and the MACD histogram shrinking toward a bearish cross.
- Bullish offsets are an RSI that is not oversold, price holding above the Oct low of about $11.44, and a ±0.05 CMF that shows no heavy distribution.
CHART PATTERNS
- Bearish Double Top (minor): Highs at $12.45 (Nov 2) and $12.52 (Nov 4) sit near the SMA 50D/EMA 55 resistance zone. The Nov 12 close at $11.90 broke the neckline of about $12.16–$12.25. The measured move (about $0.35 to $0.40 of pattern height) points to roughly $11.75–$11.80. The pattern is small, so reliability is moderate.
- Range / Bear Flag-type consolidation: Price has traded between $11.44 and $12.52 for three weeks with a weak ADX, below a declining 50D/200D cluster. It reads as a bearish continuation consolidation within a larger downtrend, with a break under $11.44 projecting toward the $11.0–$11.2 area.
- Bullish risk: If the $11.44 low holds, a Bullish Double Bottom-style base could form, but it needs a close above $12.52 to confirm.
POTENTIAL SCENARIOS
- Scenario 1: Bearish Range-Low Retest and Drift Lower — The Nov 12 neckline break and a MACD bearish cross push price back toward the October low, with the EMA 21 and SMA 50D capping bounces. Trigger: MACD signal cross, daily close below $11.75. Target: $11.40–$11.65, with an extension to $11.10 if $11.44 breaks. Invalidation: daily close above $12.25 (reclaim of EMA 21 and the double-top neckline). (50% probability)
- Scenario 2: Neutral Range Consolidation — Weak ADX keeps price oscillating between $11.45 and $12.30 with no resolution. Trigger: Low-volume chop and RSI holding 40–55. Target: $11.80–$12.10. Invalidation: close below $11.40 or above $12.55. (28% probability)
- Scenario 3: Bullish Relief Rally — Buyers defend $11.44 and push price back through the EMA 21 and toward the upper Bollinger Band and SMA 50D. Trigger: close above $12.25 with CMF above +0.05. Target: $12.45–$12.65. Invalidation: rejection at $12.42–$12.52 and a close below $11.75. (22% probability)
PRICE TARGETS
- Target Price: $11.65 (20-day, Dec 5, 2026)
- Expected Range: $11.05 to $12.25 (width $1.20, about 10.1% of current price, in line with the 14–21 day guidance of 8–12%)
- Key Levels: Support at $11.44, Resistance at $12.42
OVERALL BIAS
OVERALL BIAS: BEARISH - Price is below every major moving average and VWAP, the death cross is in place, -DI leads, RSI has rolled below 50 and the MACD is set for a bearish cross. The break of the small double-top neckline points to a retest of the $11.44 low. The weak ADX and neutral CMF keep conviction modest, so a range-bound outcome remains a real alternative.
This is educational analysis and not financial advice.