F 48-day bearish forecast — Nov 15, 2026
- Bias: Bearish
- Timeframe: 48 days (made Nov 15, 2026, target date Jan 1, 2027)
- Price at analysis: $11.91
- Price target: $11.55
- Expected range: $10.50 – $12.70
- Result: Pending — graded after the close on Jan 1, 2027
Get a free AI analysis of F today
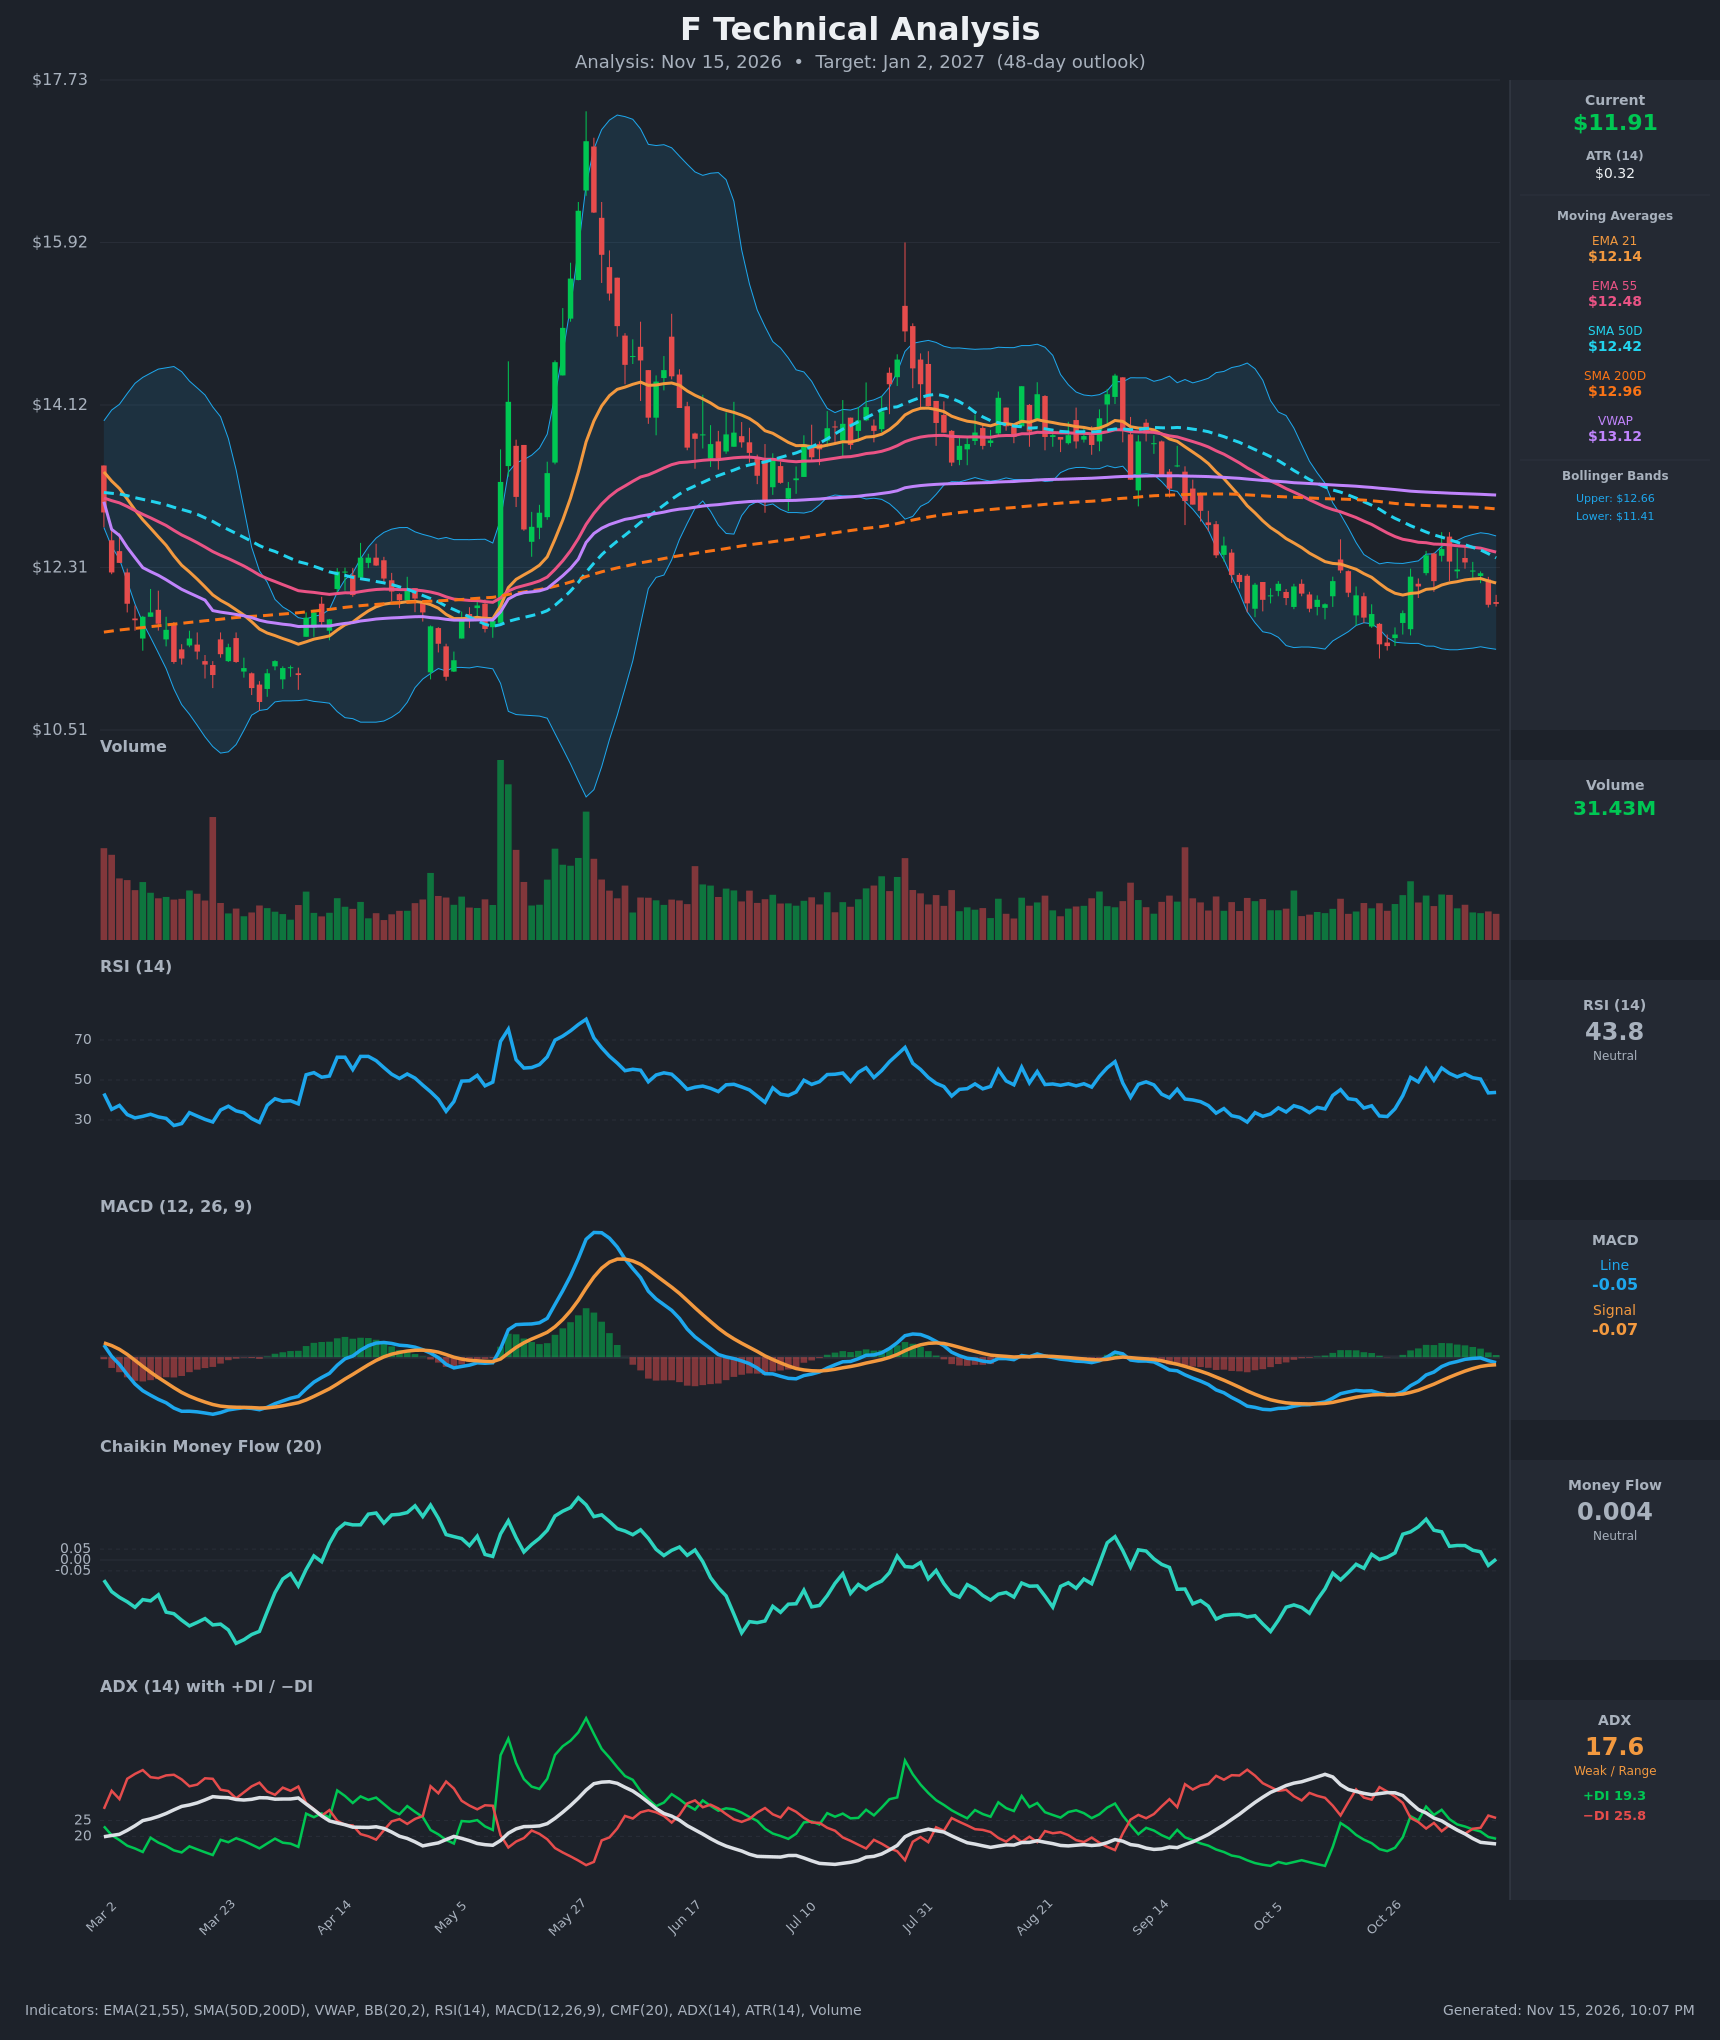
Analysis
TECHNICAL INDICATORS
- RSI (14): 43.78, down from the 50-56 zone in early November and now below the 50 midline. It is not oversold, but momentum has rolled over after the bounce from 31.7 on Oct 26. [Bearish]
- 20 EMA: The 21 EMA is $12.14, and price at $11.91 is below it. The EMA is flattening and now acts as resistance. The 21 EMA is below the 55 EMA ($12.48), a standing bearish alignment. [Bearish]
- MACD: Line -0.050, signal -0.069, so the line is still slightly above the signal. The histogram is only marginally positive and shrinking, and the line has turned down from -0.007 to -0.050. A bearish crossover looks likely within a few bars. Both lines sit below zero. [Bearish]
- Bollinger Bands (20): Upper $12.66, lower $11.41, midline about $12.04. Price is below the midline in the lower half of the bands, with the bands moderately narrow. A rejection at the midline favors a retest of the lower band near $11.41. [Bearish]
- CMF (20): 0.004, inside the ±0.05 neutral zone. It has faded from about 0.19 in early November and turned slightly negative on Nov 12, so buying pressure has evaporated. [Neutral]
- ADX (14): 17.6 with +DI 19.3 and −DI 25.8. ADX is below 20 and falling, so the trend is weak and range-bound. −DI is back above +DI after the early-November bullish stretch. [Weak Trend, bearish lean]
- Volume: 31.43M, near average with no spike on the Nov 12 drop. The decline has no strong conviction, but there is also no accumulation surge. [Neutral to mildly bearish]
DIVERGENCES & TRENDS
- No clear price/indicator divergence. The Oct 26 low of $11.44 came with RSI at 31.7. The bounce to $12.52 was a lower-high relative to the 55 EMA and SMA50D area, and RSI peaked around 56 without reclaiming 60.
- The MA stack is bearish. Price is below the 21 EMA ($12.14), 55 EMA ($12.48), SMA50D ($12.42), SMA200D ($12.96) and VWAP ($13.12).
- SMA50D ($12.42) is falling toward SMA200D ($12.96), and the gap has narrowed from the ~$12.91 vs $13.03 differential in late October. SMA50D has not yet crossed below it, but a death cross is a possibility to monitor.
- The 21 EMA is converging toward the 55 EMA from below with no bullish crossover.
- MACD has rolled over from near its signal, and RSI has lost the 50 level (Nov 12 gap down from 12.25 to 11.90).
- ADX fell from 33.8 to 17.6, meaning the prior downtrend lost strength and the market is transitioning into a range.
CHART PATTERNS
- Rounded base / range: After the Oct low near $11.40, price formed a short consolidation between roughly $11.40 and $12.50, a range inside a broader downtrend from the $14 area (Sep).
- Bearish continuation tendencies: The bounce looks like a bearish flag or rising-channel retracement following the September-October drop from ~$13.80 to ~$11.40. Rejection at the SMA50D/55 EMA zone near $12.45-$12.50 supports this. The flag measured move would point toward about $11.00-$11.20.
- Possible double bottom: If $11.40 holds on a retest, a bullish double bottom with a neckline near $12.50 would be a reversal setup, but it is not confirmed.
- The long-term structure remains a lower-high sequence below a declining SMA200D.
POTENTIAL SCENARIOS
- Scenario 1: Bearish Retest and Break of Range Low — The rejection from the 21 EMA and the Nov 12 gap down continue as price drifts toward the lower Bollinger Band and then the Oct low. MACD crosses below signal and −DI stays on top. Trigger: close below $11.75 and then below $11.40. Target: $11.00-$11.20. Invalidation: daily close above $12.50. (45% probability)
- Scenario 2: Neutral Range Chop — ADX stays under 20 and price oscillates between about $11.40 and $12.50, with a double-bottom attempt around the Oct low. Trigger: holds $11.40 and fails at $12.50. Target: $11.70-$12.20. Invalidation: close outside $11.30-$12.60. (30% probability)
- Scenario 3: Bullish Reclaim and Recovery — Buyers defend $11.40, RSI recovers above 50, and price reclaims the 21 EMA and 55 EMA, possibly with a year-end rally. Trigger: close above $12.50 with CMF above 0.05. Target: $13.00-$13.12 (SMA200D/VWAP). Invalidation: close below $11.40. (25% probability)
PRICE TARGETS
For the 48-day horizon (to about Jan 2, 2027), the weighted evidence favors a modest decline, with a mild bearish lean from the MA stack and fading momentum, and with the low-ADX range limiting downside.
- Target Price: $11.55 (48 days)
- Expected Range: $10.50 to $12.70 (width $2.20, about 18.5% of the current price, consistent with the 30-60 day guidance)
- Key Levels: Support at $11.40, Resistance at $12.14
OVERALL BIAS
OVERALL BIAS: BEARISH - Price is below every moving average and VWAP, the 21 EMA is below the 55 EMA, RSI has slipped below 50, MACD is rolling over, and −DI leads +DI. The weak ADX and a possible double bottom at $11.40 limit the downside to roughly the $11.00-$11.50 zone.
This is educational analysis and not financial advice.