NFLX 6-day bullish forecast — Nov 1, 2026
- Bias: Bullish
- Timeframe: 6 days (made Nov 1, 2026, target date Nov 6, 2026)
- Price at analysis: $62.08
- Price target: $62.75
- Expected range: $60.40 – $63.80
- Result: Correct (+2.1%) — closed at $63.41 on Nov 6, 2026; quality score 100/100
Get a free AI analysis of NFLX today
Analysis
TECHNICAL INDICATORS
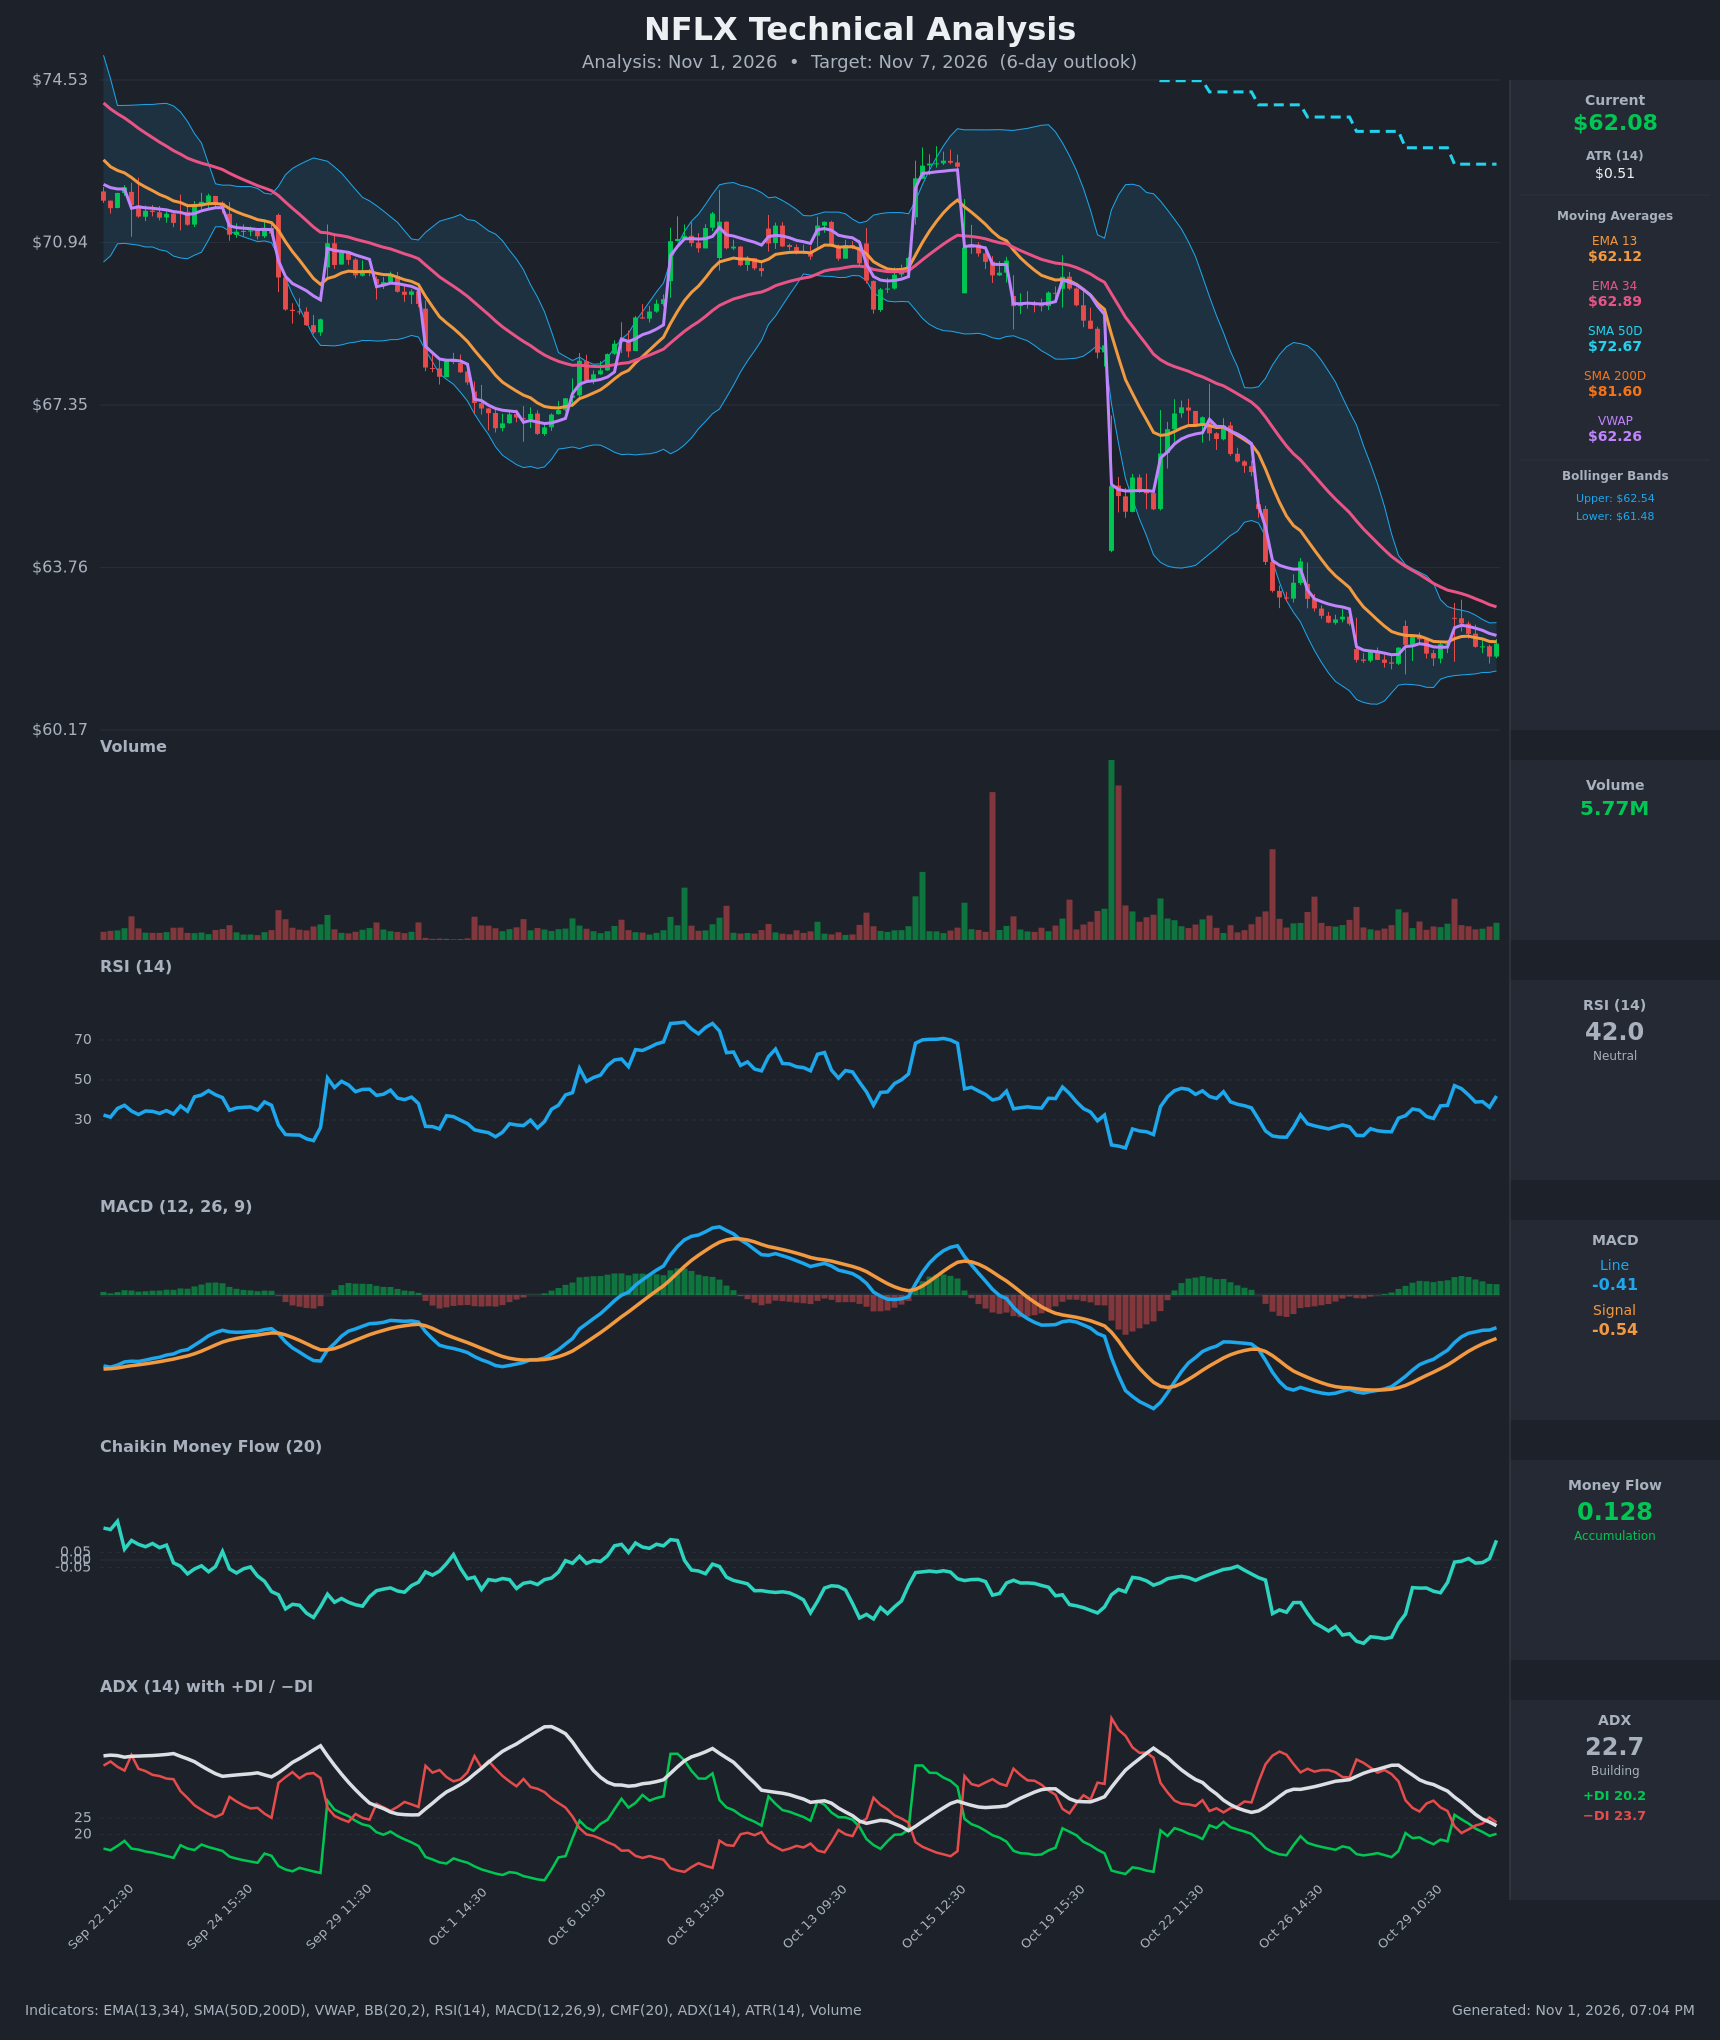
- RSI (14): 42.01, up from about 31 on Oct 29 and 36 an hour earlier. It is below 50 but making higher lows after the oversold reading near 30, so downside momentum is easing. [Neutral]
- 20 EMA (EMA 13 / EMA 34 used): EMA 13 is $62.12 and price ($62.08) sits just under it. EMA 34 is $62.89, still sloping down, and acts as overhead resistance. EMA 13 is below EMA 34, so there is no bullish crossover yet, but the gap has narrowed from about $1.60 to about $0.77. [Bearish]
- MACD: Line -0.408 is above the signal at -0.542, so it has crossed up. The histogram is positive and widening, and both lines are still below zero, so this is a relief rally inside a larger downtrend. [Bullish]
- Bollinger Bands (20): Upper $62.54, lower $61.48, a band only about $1.07 wide. This is a clear squeeze after the steep decline. Price is in the middle of the bands, with the midline near $62.01, so a volatility expansion is likely and direction is not confirmed. [Neutral]
- CMF (20): 0.128, which is accumulation. It turned positive from -0.41 on Oct 28, so buying pressure has returned. This is a meaningful improvement, though the reading is only one bar old. [Accumulation]
- ADX (14): 22.7 and falling from 41, so the downtrend is losing strength. −DI (23.7) is only marginally above +DI (20.2), and the gap has narrowed sharply from 36 vs 15. [Weak Trend, bearish lean fading]
- Volume: 5.77M, with no spike during the base-building. Selling volume has faded versus the earlier breakdown bars, which suggests sellers are drying up but buyers are not yet aggressive. [Neutral, slightly constructive]
Other context:
- Moving averages: Price is far below SMA50 ($72.67) and SMA200 ($81.60), so the long-term trend is clearly down, with SMA50 well below SMA200 (a death cross in force).
- VWAP: Price is at about VWAP ($62.26), so it is basically flat against it.
DIVERGENCES & TRENDS
- RSI and MACD are making higher lows while price makes marginally lower or equal lows around $61.4–61.8. This is an early bullish divergence and a sign of selling exhaustion.
- CMF has swung from deeply negative to positive. This supports a bounce and is the strongest short-term bullish signal.
- MACD crossed above its signal line, and the histogram is turning positive.
- ADX is falling from 41 to 22.7 and the DIs are converging. The trend is exhausting, and a +DI/−DI crossover is within reach.
- Bearish counterpoints: price has not reclaimed EMA 34 or the declining SMA50/200, and the lower-high structure since Oct 22 is intact.
- Bollinger Bands are in a tight squeeze, so a directional break is likely within the 6-day window.
CHART PATTERNS
- Bearish Flag/Pennant (continuation): The sharp drop from about $67 to $62 followed by a tight sideways drift fits this shape. A break below about $61.45 would project roughly $59–60.
- Bullish Falling Wedge / Double Bottom (reversal): The repeated defence of $61.4–61.8 and the higher lows in RSI and MACD fit a basing structure. A close above about $62.90 (EMA 34) and then $63.4–63.8 would confirm a bounce. The measured relief target is about $63.5–64.
- Bollinger squeeze: This is not a diagram pattern, but it signals a coming volatility expansion.
- The tight range and the improving momentum indicators slightly favour a relief bounce over a breakdown. The larger downtrend limits the upside.
POTENTIAL SCENARIOS
- Scenario 1: Bullish Relief Bounce to EMA 34 — Positive CMF, the MACD cross and RSI higher lows drive a squeeze breakout. Price reclaims EMA 13 and VWAP and tests the declining EMA 34. Trigger: close above $62.55 (upper Bollinger Band) on rising volume. Target: $62.90–63.60. Invalidation: close below $61.40. (45% probability)
- Scenario 2: Bearish Downtrend Continuation — The bear flag resolves lower as −DI stays on top and sellers use EMA 34 as resistance. Trigger: break below $61.48 (lower band) with rising volume. Target: $60.20–60.80. Invalidation: close above $62.90. (40% probability)
- Scenario 3: Neutral Squeeze Chop — Price keeps drifting inside $61.5–62.6 as the ADX falls below 20. Trigger: no close outside the Bollinger Bands. Target: $61.80–62.40. Invalidation: any decisive close beyond $62.60 or $61.40. (15% probability)
PRICE TARGETS
- Target Price: $62.75 (6-day horizon)
- Expected Range: $60.40 to $63.80 (width $3.40, about 5.5% of current price, consistent with the 4–8% guidance for 6 days)
- Key Levels: Support at $61.48, Resistance at $62.89
OVERALL BIAS
OVERALL BIAS: BULLISH - Momentum is turning up, with a MACD bullish cross, RSI higher lows, a CMF swing to accumulation and a fading ADX. This favours a modest relief bounce toward the EMA 34 at about $62.9. Conviction is modest because price is still below all key moving averages and −DI remains on top.
This is educational analysis and not financial advice.