NFLX 27-day bearish forecast — Nov 15, 2026
- Bias: Bearish
- Timeframe: 27 days (made Nov 15, 2026, target date Dec 11, 2026)
- Price at analysis: $62.15
- Price target: $59.50
- Expected range: $54.00 – $65.50
- Result: Pending — graded after the close on Dec 11, 2026
Get a free AI analysis of NFLX today
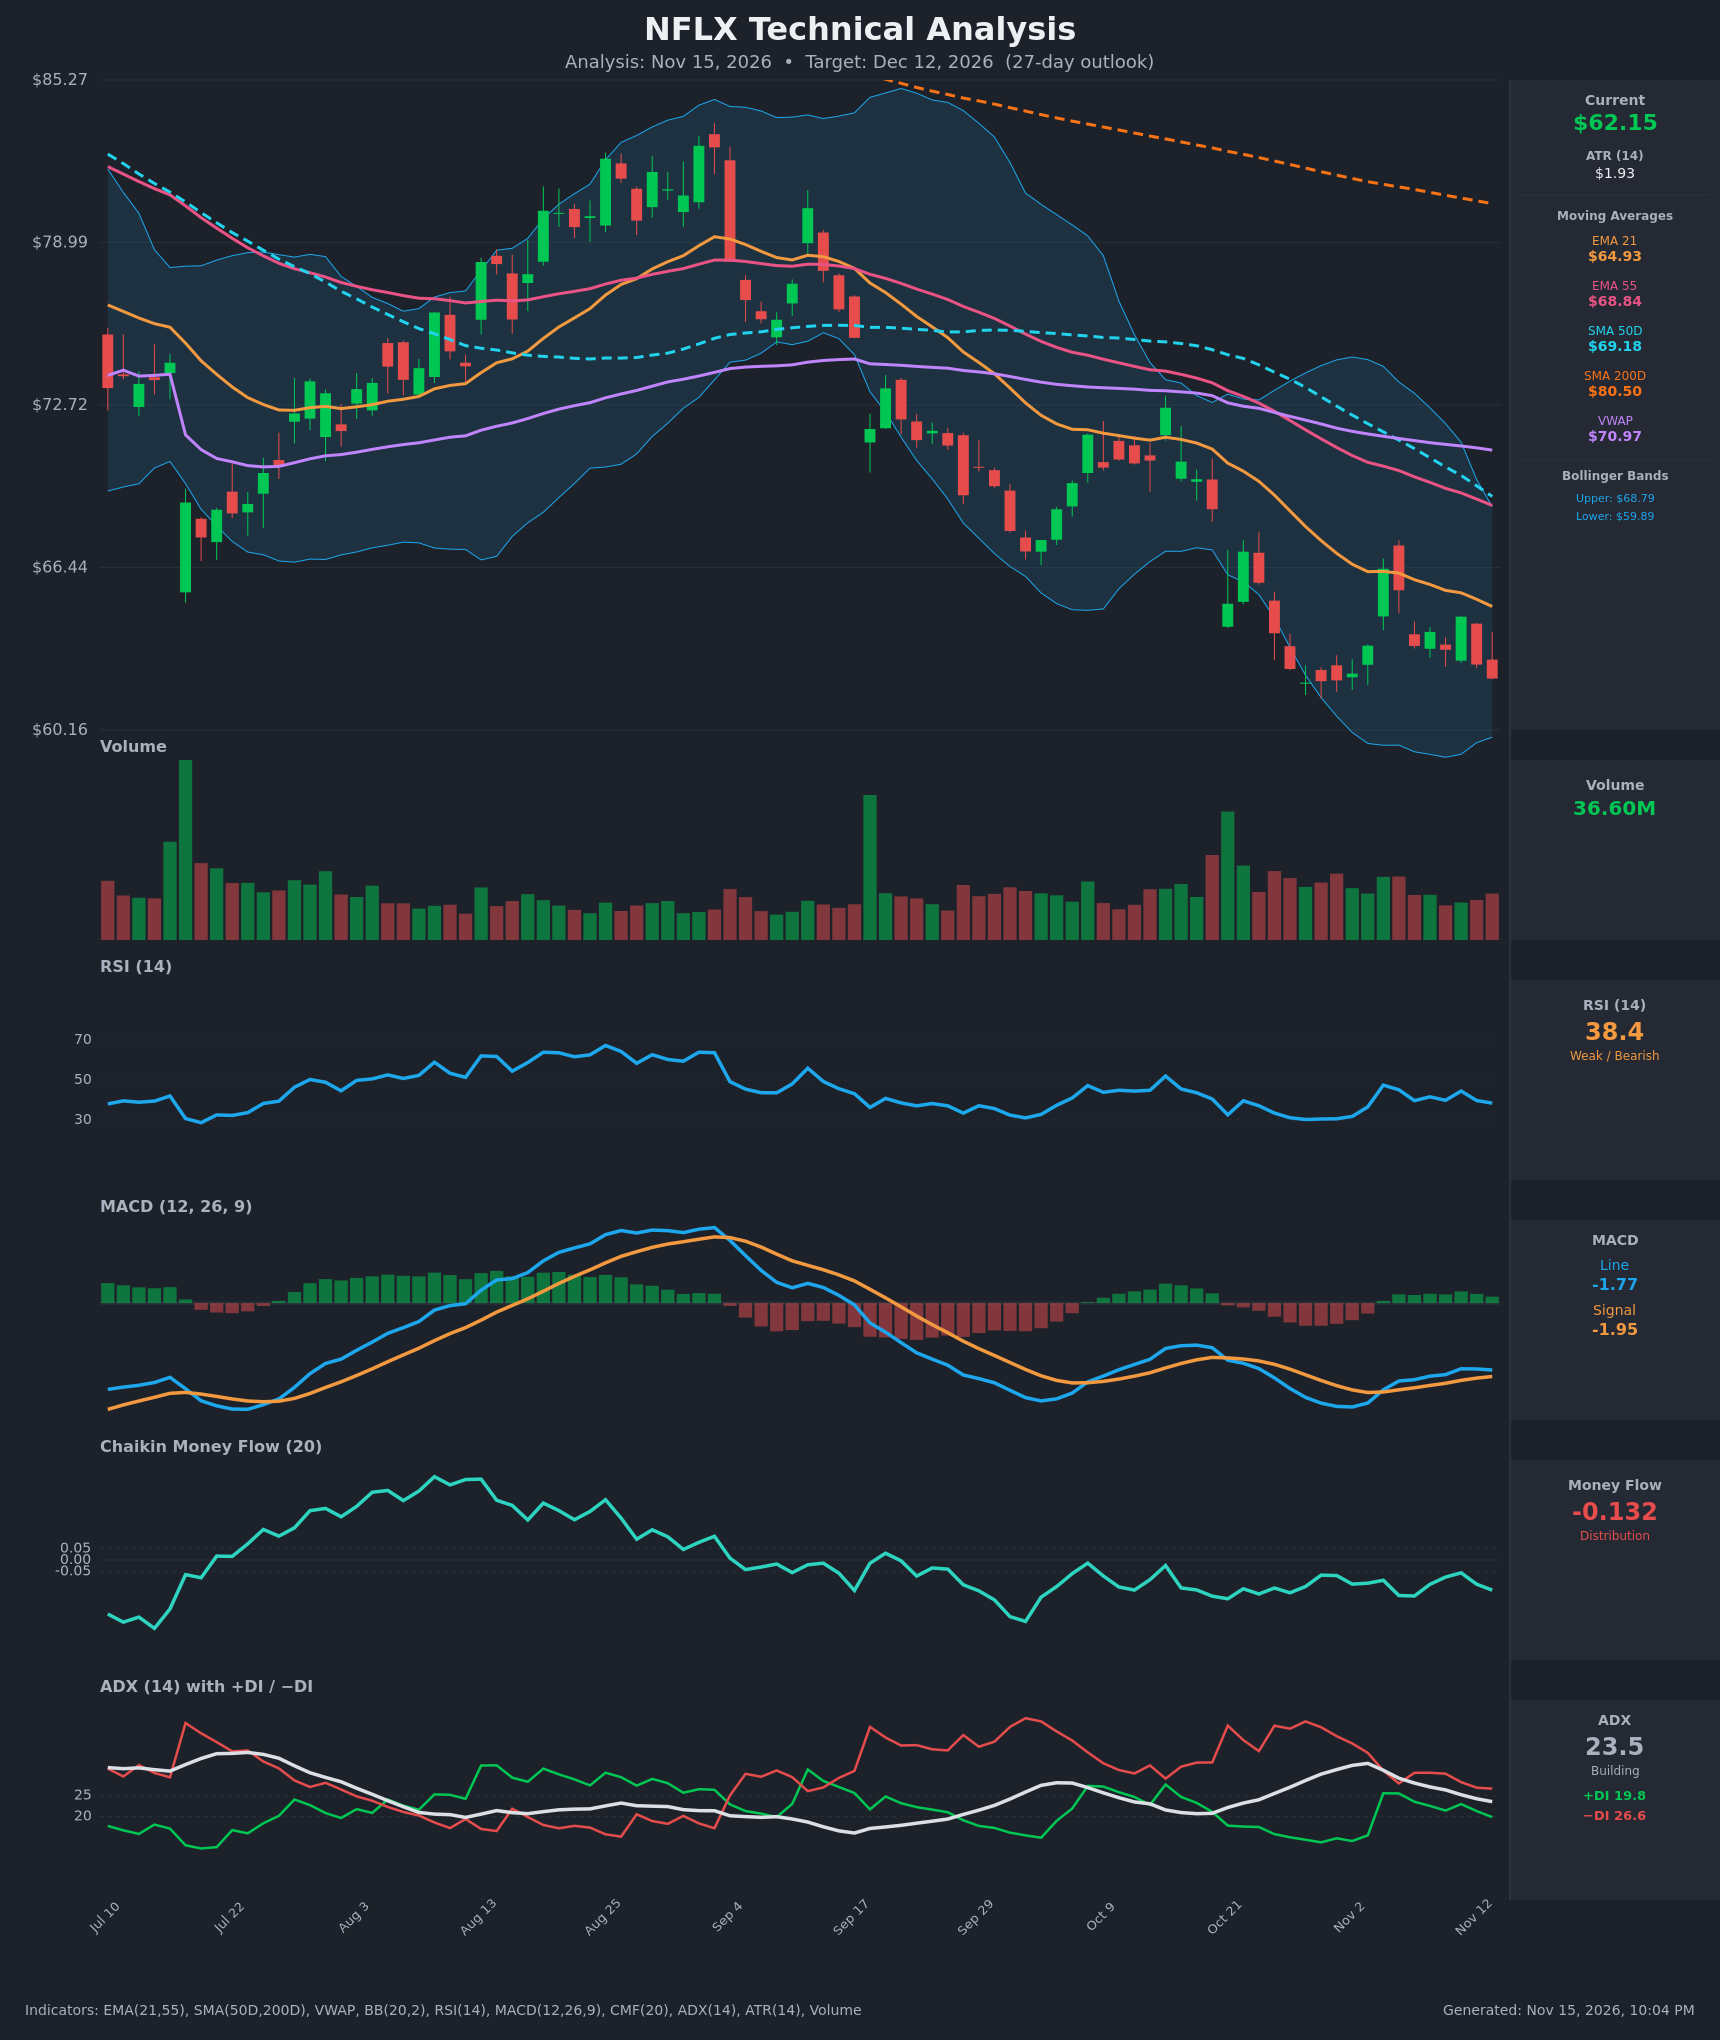
Analysis
TECHNICAL INDICATORS
- RSI (14): 38.43, below 50 and just above the oversold zone (30). It bounced from about 30 in late October to 47.5 on Nov 4, then rolled over again with lower highs (44.5 on Nov 11). Momentum is weak and tilting down. [Bearish]
- 20 EMA (EMA 21): $64.93, with price at $62.15 below it. The EMA 21 is also below the EMA 55 ($68.84) and sloping down, so it acts as dynamic resistance. Price has failed at it several times (Nov 4 and Nov 11 rallies faded). [Bearish]
- MACD: Line -1.774 is above signal -1.946, a mild positive histogram of about +0.17. Both lines are deeply negative, and the line has flattened and is rolling over against the signal (the Nov 11 reading of -1.740 vs. -1.774 now). It is a tentative bullish cross within a bearish regime, and the histogram is fading. [Neutral]
- Bollinger Bands (20): Upper $68.79, lower $59.89, midline about $64.34. Price at $62.15 sits in the lower half, below the midline, and about $2.26 above the lower band. The bands are contracting after the October expansion, and the price walk along the lower band has eased. [Bearish]
- CMF (20): -0.132, firmly below -0.05 and negative throughout the recent period (range -0.06 to -0.16). Sustained selling pressure and distribution. [Distribution]
- ADX (14): 23.5, down from a peak of 32.7 on Nov 3 but still near the trend threshold. −DI (26.6) is above +DI (19.8), so bears control. The trend is fading in strength but remains down. [Moderate Trend, Bearish]
- Volume: 36.60M. Volume is average with no capitulation spike during the recent decline, apart from the Oct 21 high-volume breakdown. The bounces have come on modest volume, indicating a lack of strong buyer conviction. [Bearish]
DIVERGENCES & TRENDS
- Moving average structure: Price ($62.15) < EMA21 ($64.93) < EMA55 ($68.84) < SMA50D ($69.18) < SMA200D ($80.50) < VWAP is $70.97 above price. This is a fully bearish stack, and the SMA50D is declining toward the EMA55. The death cross (SMA50D below SMA200D) has already occurred.
- RSI/MACD: RSI made a lower low near 30 in late October and no higher highs since. MACD made a higher low relative to its late-October trough (-2.754 vs. -1.774 now), a mild bullish momentum divergence versus the price low of about $61.99. That suggests selling momentum is decelerating, not reversing.
- Price vs. lower Bollinger Band: Price rejected at the midline/EMA21 twice (Nov 4 high $66.39 and Nov 11 $64.54). These are lower highs, a bearish structure.
- ADX/DI: −DI remains above +DI. The +DI spike on Nov 4 (25.5) faded quickly. ADX falling from 32.7 indicates the downtrend is losing steam and could transition into a range.
- CMF: Persistently negative with no positive divergence.
CHART PATTERNS
- Bearish Pennant / Flag-like consolidation: After the sharp decline from about $72 to $62 in October, price has stalled in a tight range of about $61.99–$66.39. The lower highs and flat-ish lows resemble a Bearish Flag/Pennant (continuation), implying a measured move lower. The pole is roughly $9–10; a break below about $61.50 targets approximately $55–57.
- Descending Triangle tendency: Support near $62 has been tested multiple times (Oct 28–30, Nov 12–13), with lower highs above it. A breakdown below support would confirm this bearish continuation.
- Alternate reading (Bullish Double Bottom): The Oct 28 low ($61.99) and the current retest ($62.15) form a possible double bottom, but confirmation needs a close above $66.39 and is not yet present.
POTENTIAL SCENARIOS
- Scenario 1: Bearish Breakdown Continuation — Price loses the $61.99 double-low support and continues the downtrend, with the bearish stack, negative CMF, and −DI dominance feeding more selling. Trigger: daily close below $61.50 on rising volume. Target: $57.50–$59.00 (lower Bollinger Band area, then pennant measured move toward $56). Invalidation: daily close above $65.00 (EMA21). (50% probability)
- Scenario 2: Neutral Range Chop — Price holds the $61.50–$62 support zone and oscillates beneath EMA21 resistance as ADX fades and the bands contract. Trigger: repeated defenses of $61.99 with low volume. Target: $60.50–$64.50. Invalidation: close below $60 or above $65.50. (25% probability)
- Scenario 3: Bullish Double-Bottom Relief Rally — The mild MACD divergence and a hold of the double low spark a bounce to the EMA21 and mid-band, with an extended push toward the EMA55. Trigger: close above $64.93 then $66.40 with improving CMF. Target: $66.40–$68.80. Invalidation: close back below $61.50. (25% probability)
PRICE TARGETS
- Target Price: $59.50 (27-day, modest downside toward the lower Bollinger Band and below the $61.99 double-low as the bearish stack persists)
- Expected Range: $54.00 to $65.50 (width $11.50, about 18.5% of the current price, in line with the 30–60 day guidance scaled for 27 days)
- Key Levels: Support at $61.99 (recent double-low), Resistance at $64.93 (EMA 21)
Self-check: width = $65.50 − $54.00 = $11.50; 11.50 / 62.15 ≈ 18.5%, matching the ~12–18% band for this horizon (slightly above due to the elevated ATR of $1.93, about 3.1% daily). Target $59.50 is below the current price of $62.15, consistent with the bearish bias.
OVERALL BIAS
OVERALL BIAS: BEARISH - Price is below every moving average in a fully bearish stack (death cross in place), −DI dominates +DI, CMF is deeply negative at -0.132, and the bounces keep failing at the EMA21 with lower highs. The mild MACD improvement and fading ADX temper conviction, but the path of least resistance is a break of the $61.99 support.
This is educational analysis and not financial advice.