NFLX 48-day bearish forecast — Nov 15, 2026
- Bias: Bearish
- Timeframe: 48 days (made Nov 15, 2026, target date Jan 1, 2027)
- Price at analysis: $62.15
- Price target: $58.50
- Expected range: $53.50 – $64.50
- Result: Pending — graded after the close on Jan 1, 2027
Get a free AI analysis of NFLX today
Analysis
TECHNICAL INDICATORS
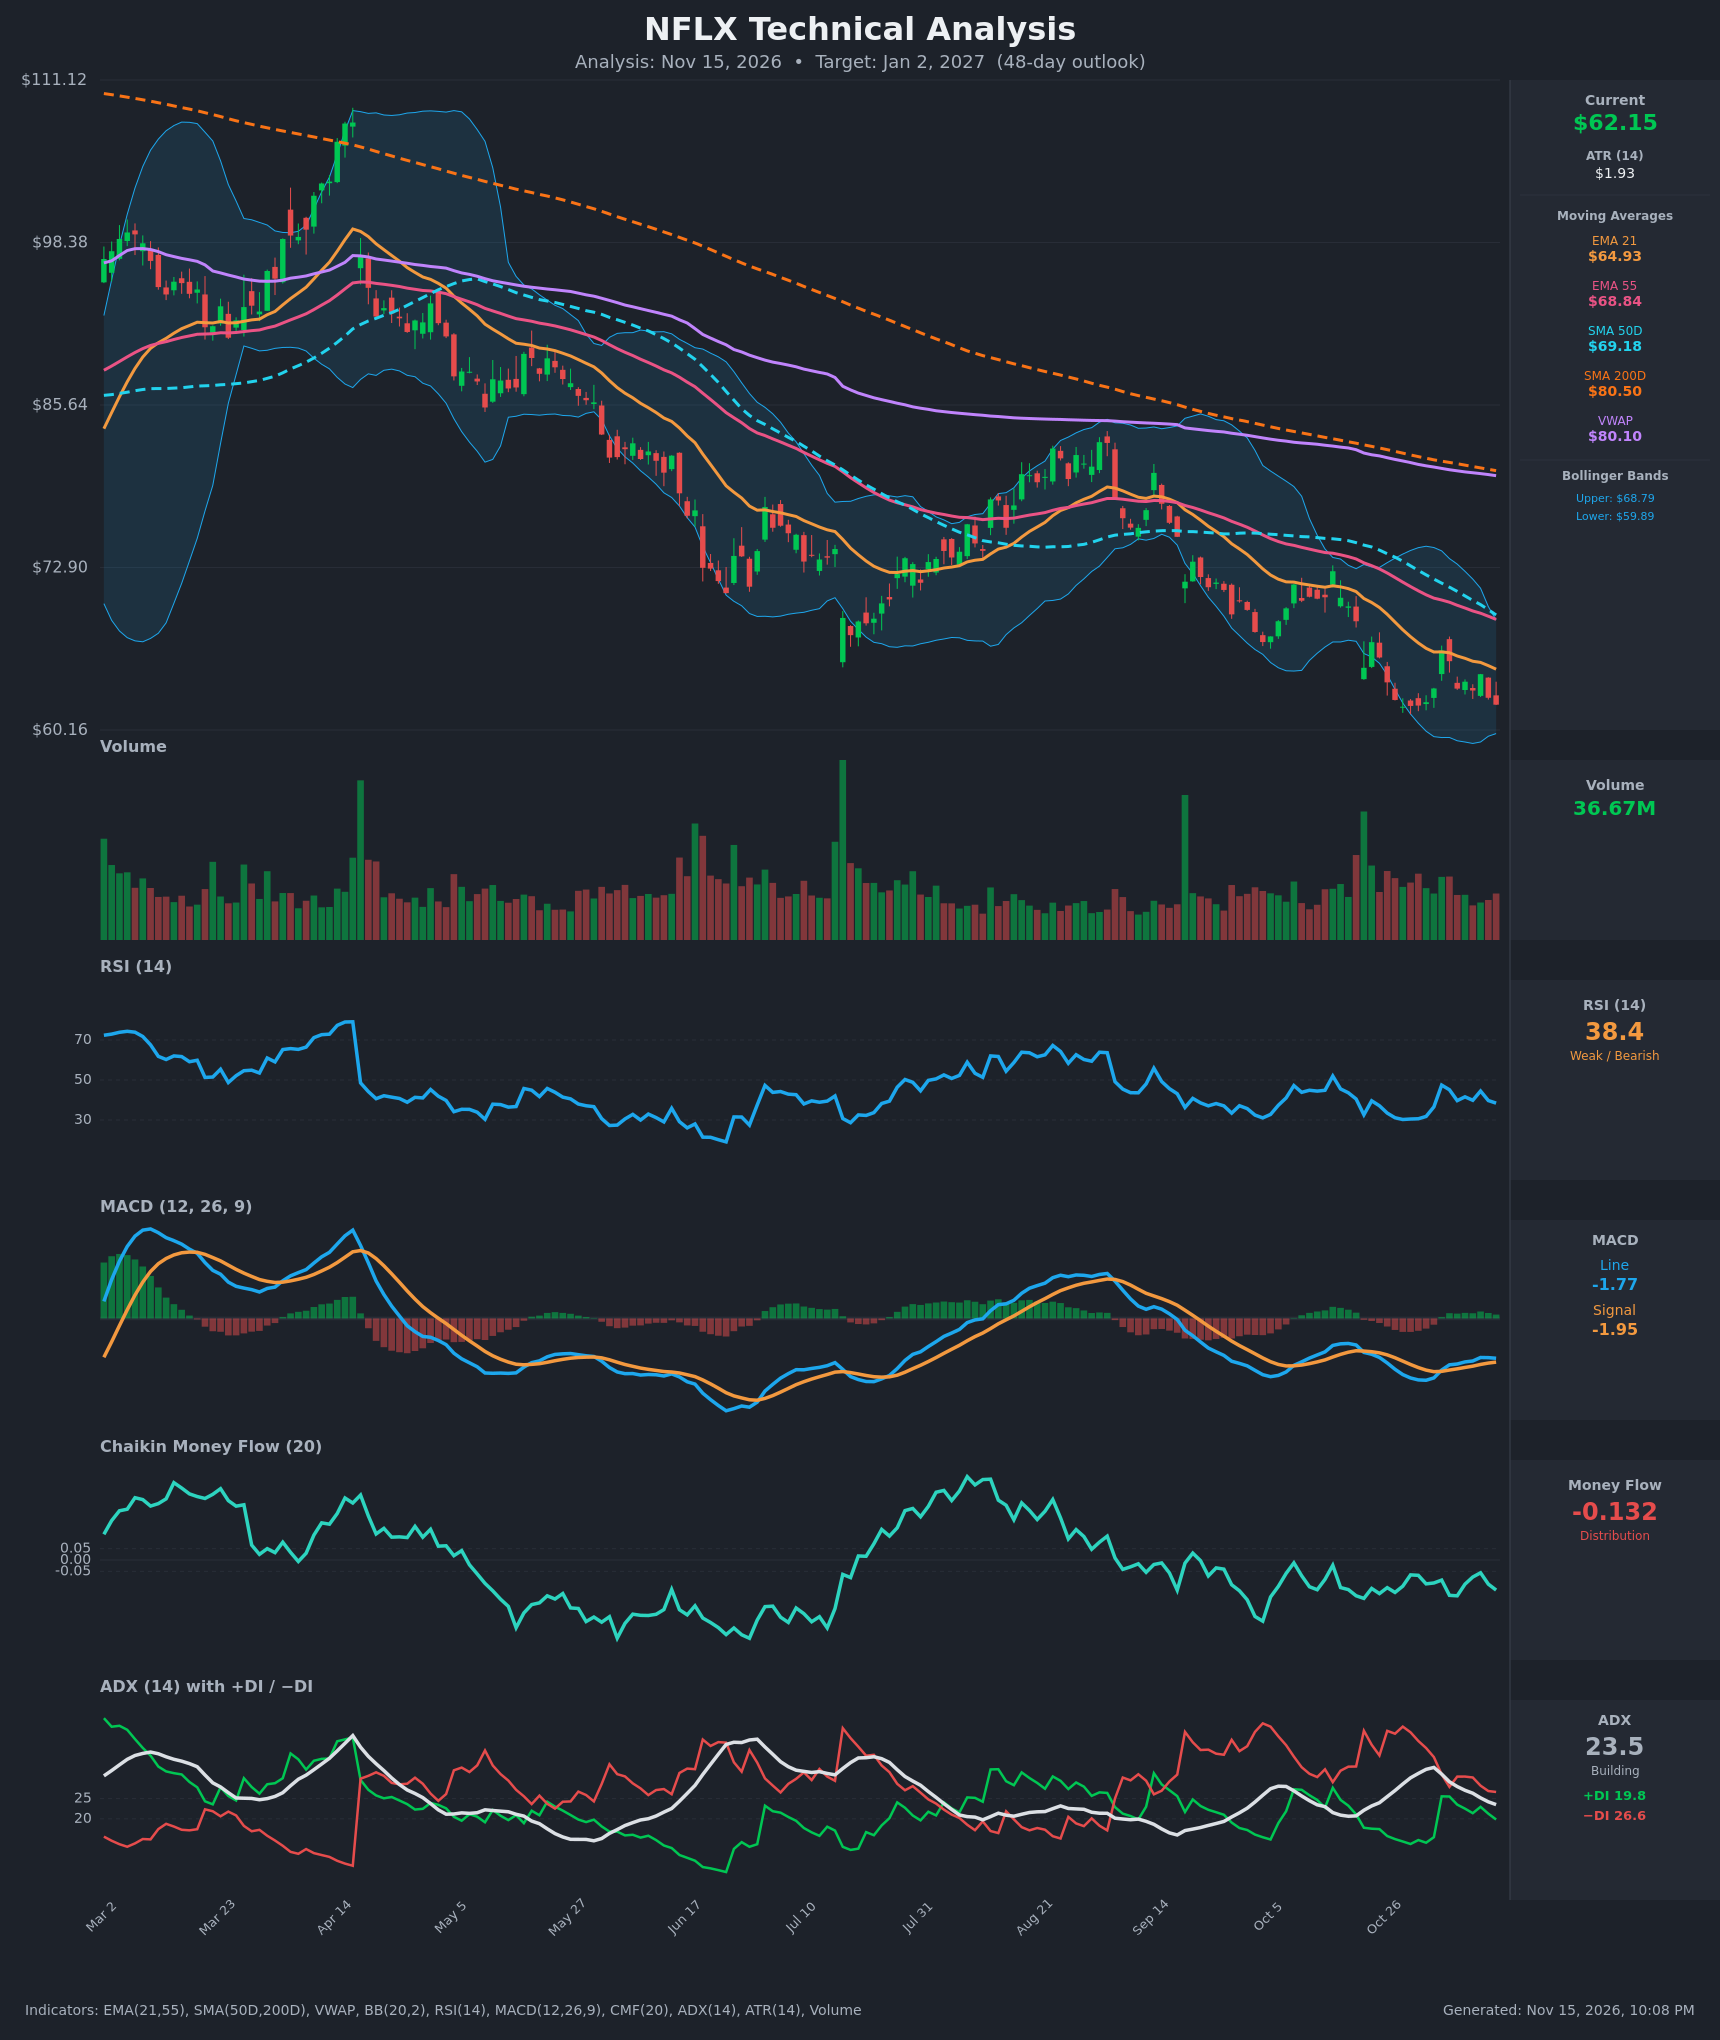
- RSI (14): 38.43, below neutral 50 but not oversold. It bounced from about 30 in late October to 47.5 on Nov 4, then rolled over with lower highs (47.5, 44.5). Momentum is weak and fading. [Bearish]
- 20 EMA (EMA 21 = $64.93): Price at $62.15 is about 4% below it, and the EMA is still sloping down. It is overhead resistance and capped the Nov 11 bounce ($64.54). [Bearish]
- MACD: Line -1.774, signal -1.945, histogram about +0.17. The line crossed above the signal around Nov 5, but both are deep below zero. The histogram peaked at about +0.31 on Nov 11 and is shrinking, so this looks like a weak relief cross that is rolling over. [Neutral/Bearish]
- Bollinger Bands (20): Upper $68.79, lower $59.89, so price sits in the lower third, about $2.3 above the lower band. The bands are narrowing from the earlier volatility. The mid-band (about $64.3) has acted as resistance. A band-walk lower is possible if $62 breaks. [Bearish]
- CMF (20): -0.132, well below -0.05 and in sustained distribution since September, with no accumulation signal on the bounces. [Distribution]
- ADX (14): 23.5 and falling from a 32.7 peak. −DI (26.6) is above +DI (19.8), so bears are still in control, though the gap has narrowed from 41.7 vs 15.8. The trend is moderate and losing strength. [Moderate Trend – Bearish]
- Volume: 36.67M, around average with no capitulation spike. The Nov 4 bounce came on only modest volume, so there is no sign of a washout bottom. Selling pressure is steady rather than panicked. [Neutral/Bearish]
DIVERGENCES & TRENDS
- Price is still below every moving average: EMA21 $64.93, EMA55 $68.84, SMA50D $69.18, SMA200D $80.50, VWAP $80.10. The EMA55 and SMA50D are converging near $69, and SMA50D is far below SMA200D. This is a death-cross structure with a firmly established long-term downtrend.
- There is no clean bullish divergence. RSI made a higher low versus the ~25 reading in June, but that comparison is too stretched to be meaningful. At the late-October price low (~$61.99), RSI held about 30, and the following bounce failed at lower highs.
- The MACD bullish cross is weak. It occurred below zero and the histogram is already contracting.
- CMF has stayed negative on every bounce, which confirms that rallies are being sold.
- ADX is rolling over from 32.7, so selling momentum is slowing. That raises the odds of consolidation or a bounce, but −DI still leads.
- Price is making lower highs ($66.39 → $65.56 → $64.54) against a flat floor around $62.
CHART PATTERNS
- Descending Triangle (continuation, bearish): There is a flat floor around $62.0–62.2 (Oct 28–30 closes at $61.99/$62.05/$62.08, and Nov 13 at $62.15) and lower highs from $66.39 to $64.54. A close below about $61.5 would project a measured move of roughly the triangle height (about $4.4) to around $57–58.
- Broader Downtrend: This is a series of lower highs and lower lows since April, with price rejected at the falling EMAs. It is a bearish continuation structure.
- Counter-pattern risk (Bullish Falling Wedge / Double Bottom): Repeated tests of $62 and the narrowing ADX could produce a base. This needs a close above $64.93–66.4 to confirm, which would target the mid-to-upper $60s ($68.8 EMA55/Upper BB).
POTENTIAL SCENARIOS
- Scenario 1: Bearish Descending-Triangle Breakdown — Price loses the $62 floor and the lower Bollinger Band, and distribution continues. Trigger: daily close below $61.50 on rising volume. Target: $57.50–$59.00, with an extension toward $55 on a band walk. Invalidation: daily close above $64.93 (EMA21). (50% probability)
- Scenario 2: Bullish Relief Bounce / Base Formation — Support at $62 holds, the MACD cross extends, and price squeezes up toward the moving-average cluster. Trigger: close above $64.93, then $66.40. Target: $66.40–$68.80 (EMA55/Upper BB). Invalidation: close below $61.50. (33% probability)
- Scenario 3: Neutral Range Consolidation — Price chops between $60 and $65 as ADX fades and volatility compresses. Trigger: failure to close outside $60–$65 for several weeks. Target: about $62–$63. Invalidation: close outside $59.89 or $65. (17% probability)
PRICE TARGETS
- Target Price: $58.50 (48-day horizon, Jan 2, 2027)
- Expected Range: $53.50 to $64.50 (width $11.00, about 17.7% of the current price, consistent with the 30–60 day guidance)
- Key Levels: Support at $59.89 (lower Bollinger Band), Resistance at $64.93 (EMA 21)
OVERALL BIAS
OVERALL BIAS: BEARISH - Price is below all key moving averages with −DI above +DI, persistent CMF distribution, and a descending-triangle structure pressing on the $62 floor. The MACD cross is weak and below zero, and the bounces are being sold at lower highs. A bounce is possible given the fading ADX, but the weight of evidence favors a break lower.
This is educational analysis and not financial advice.