NFLX 62-day bearish forecast — Nov 15, 2026
- Bias: Bearish
- Timeframe: 62 days (made Nov 15, 2026, target date Jan 15, 2027)
- Price at analysis: $62.15
- Price target: $58.50
- Expected range: $50.50 – $67.50
- Result: Pending — graded after the close on Jan 15, 2027
Get a free AI analysis of NFLX today
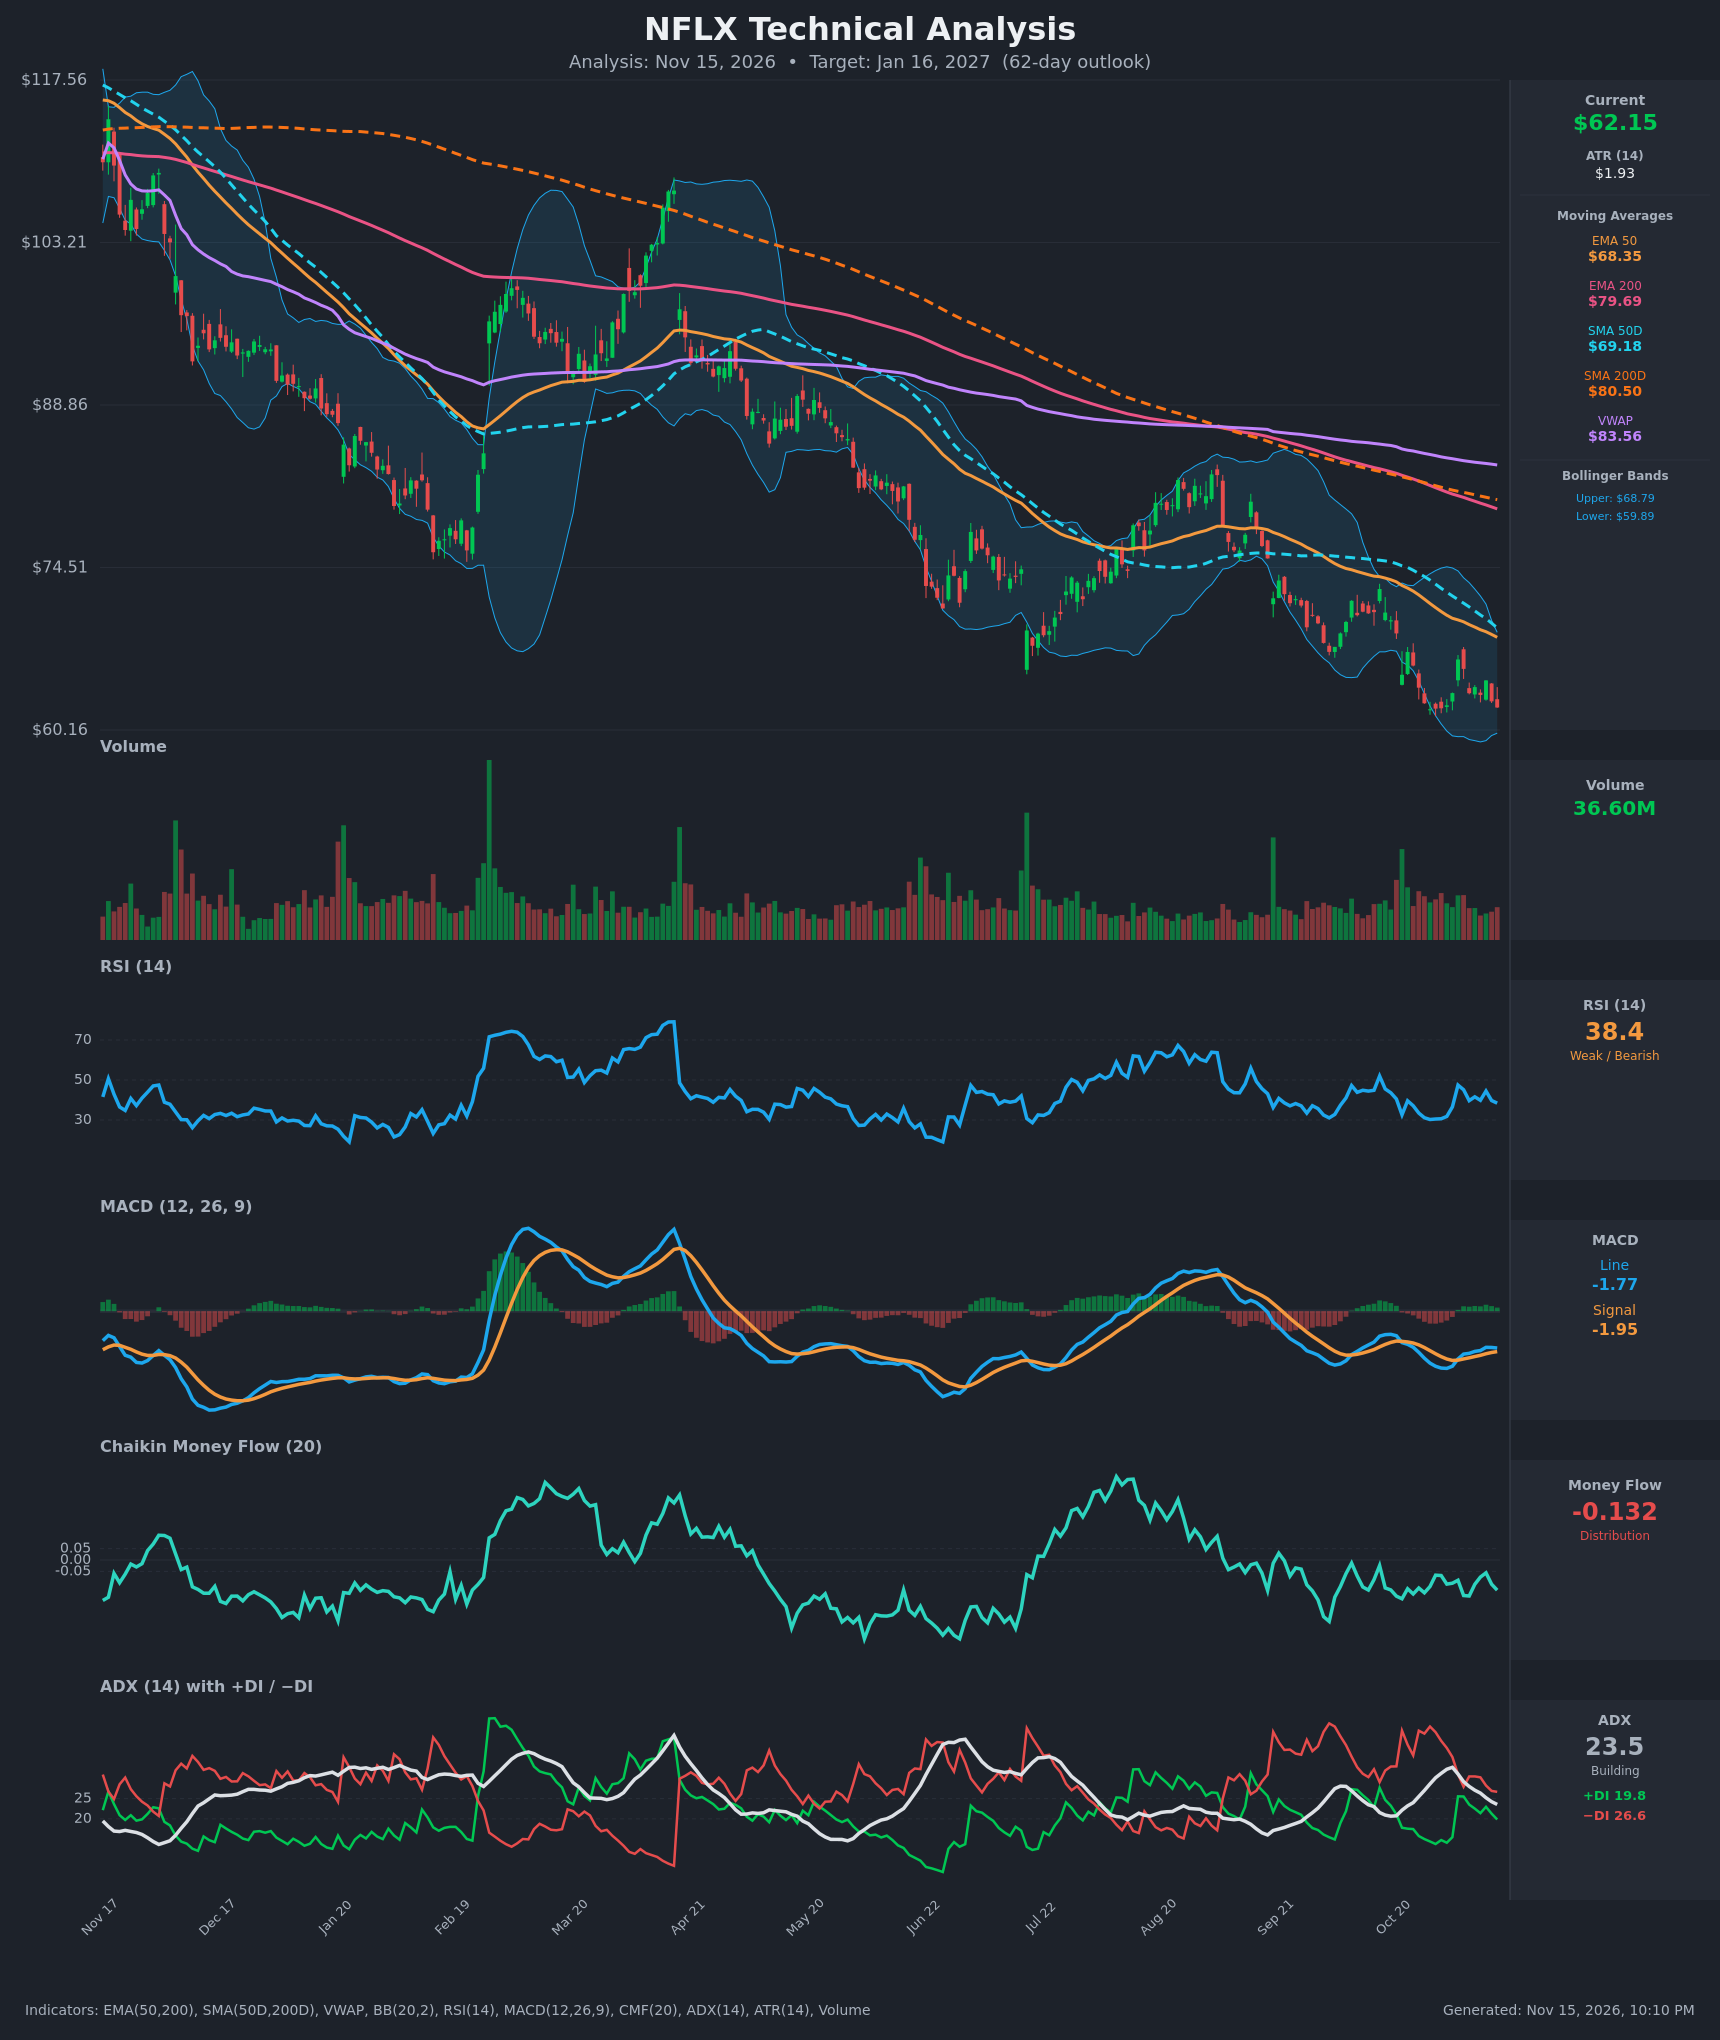
Analysis
TECHNICAL INDICATORS
- RSI (14): 38.43, below the 50 midline and above oversold (30). It bounced from about 30 in late October to 47 on Nov 4, then rolled over again. Momentum is weak with lower highs. [Bearish]
- 20 EMA: Not supplied. The EMA 50 at $68.35 and the 20-period Bollinger midline (~$64.3) both sit above price at $62.15. Price is below every moving average, so they act as overhead resistance. [Bearish]
- MACD: Line -1.774 is above Signal -1.946, a small bullish crossover on Nov 4 (histogram about +0.17). Both lines are well below zero, so this is only a mild momentum improvement inside a downtrend. The line has flattened over the last three bars (-1.74, -1.75, -1.77) and could roll over again. [Neutral]
- Bollinger Bands (20): Upper $68.79, lower $59.89, midline about $64.34. Price is in the lower half, about 26% of the band width above the lower band. The bands are narrow, and the lower band is near the multi-year low on the chart. Price has stayed below the midline for most of the past two weeks. [Bearish]
- CMF (20): -0.132, below the -0.05 threshold and negative for the whole 15-bar table (range -0.056 to -0.158). Selling pressure persists. [Distribution]
- ADX (14): 23.5 and falling from 32.7 on Nov 3. -DI at 26.6 is above +DI at 19.8, so bears are in control, though the trend is weakening and the DI spread has narrowed from 26 points (Oct 26) to about 7. [Moderate Trend, Bearish]
- Volume: 36.60M, around average with no capitulation spike. The last decline came on ordinary volume, so there is no sign of a selling climax or a volume-backed reversal. [Neutral to Mildly Bearish]
DIVERGENCES & TRENDS
- Death cross: SMA50D ($69.18) is below SMA200D ($80.50) and the EMA50 is below the EMA200 ($79.69). The gap is wide, which confirms a long-term downtrend.
- Price vs. VWAP: Price is far below VWAP ($83.56), about 26% under it, which signals sustained selling pressure and a heavily extended move.
- MACD vs. price: Price made a marginal new low at $62.15, which is below the Oct 28 close of $61.99 only if intraday lows are ignored, and the MACD low (-2.75 on Nov 2) is higher than the Oct 30 level. This is a mild bullish momentum divergence that has not yet been confirmed by price or RSI.
- RSI: Lower highs since the Nov 4 spike (47.5, 44.5, now 38.4). No bullish RSI divergence is confirmed.
- ADX: Falling from 32.7 to 23.5, so the downtrend is losing strength. The market could be turning into a base or a sideways phase.
- Price action: Lower highs and lower lows since February. Price is stuck in the $62-$66 range and is pressing against the lower Bollinger Band area.
CHART PATTERNS
- Bearish Pennant/Flag (continuation): The tight consolidation from about $62 to $66.4 after the steep October decline resembles a small bearish flag/pennant. A break below ~$61.5 projects the flagpole height (~$7-8) down toward $54-$55.
- Bullish Falling Wedge / Double Bottom (reversal, possible): The $62 area has been tested several times (Oct 28 at $61.99, Oct 29 at $62.05, Oct 30 at $62.08, Nov 13 at $62.15), which looks like a triple-bottom base. A close above $66.4 (the Nov 4 high) would activate a bounce toward the $68-$69 band and EMA50, but nothing is confirmed.
- Larger structure: The chart shows a persistent descending channel of lower highs since the $117 peak. The bearish continuation pattern has the edge until price recovers the EMA50.
POTENTIAL SCENARIOS
- Scenario 1: Bearish Continuation Breakdown — The multi-test floor at $62 gives way as the death-cross downtrend, negative CMF, and −DI dominance continue. Trigger: daily close below $61.50 on rising volume. Target: $55.00, with extension to $52.50. Invalidation: daily close above $66.50. (50% probability)
- Scenario 2: Neutral Base and Range — Fading ADX and a minor MACD bullish crossover lead to a sideways range as the market digests the decline. Trigger: holds $60-$62 and rallies back to the $66-$68 area without breaking out. Target: $62-$66. Invalidation: close below $59.50 or above $69. (25% probability)
- Scenario 3: Bullish Relief Rally — The triple-bottom area holds and oversold mean reversion pushes price back to the EMA50/SMA50. Trigger: close above $66.40 with CMF turning positive. Target: $69-$70, with a stretch to $72. Invalidation: close back below $61.50. (25% probability)
PRICE TARGETS
- Target Price: $58.50 (62-day horizon)
- Expected Range: $50.50 to $67.50. Width is $17.00, or about 27% of current price, which fits the 61-180 day guidance (18-30%) and is far wider than a short-term range.
- Key Levels: Support at $59.89 (lower Bollinger Band), with deeper support at $55.00. Resistance at $66.40 (Nov 4 high), then $68.35 (EMA50).
OVERALL BIAS
OVERALL BIAS: BEARISH - Price is below every major moving average and VWAP, with a death cross in place, persistent CMF distribution (-0.132), and −DI above +DI. The only support is a triple-tested $62 floor and a minor MACD crossover, and a break below it would project toward the mid-$50s.
This is educational analysis and not financial advice.