NFLX 34-day bearish forecast — Nov 15, 2026
- Bias: Bearish
- Timeframe: 34 days (made Nov 15, 2026, target date Dec 18, 2026)
- Price at analysis: $62.15
- Price target: $60.50
- Expected range: $54.50 – $67.00
- Result: Pending — graded after the close on Dec 18, 2026
Get a free AI analysis of NFLX today
Analysis
TECHNICAL INDICATORS
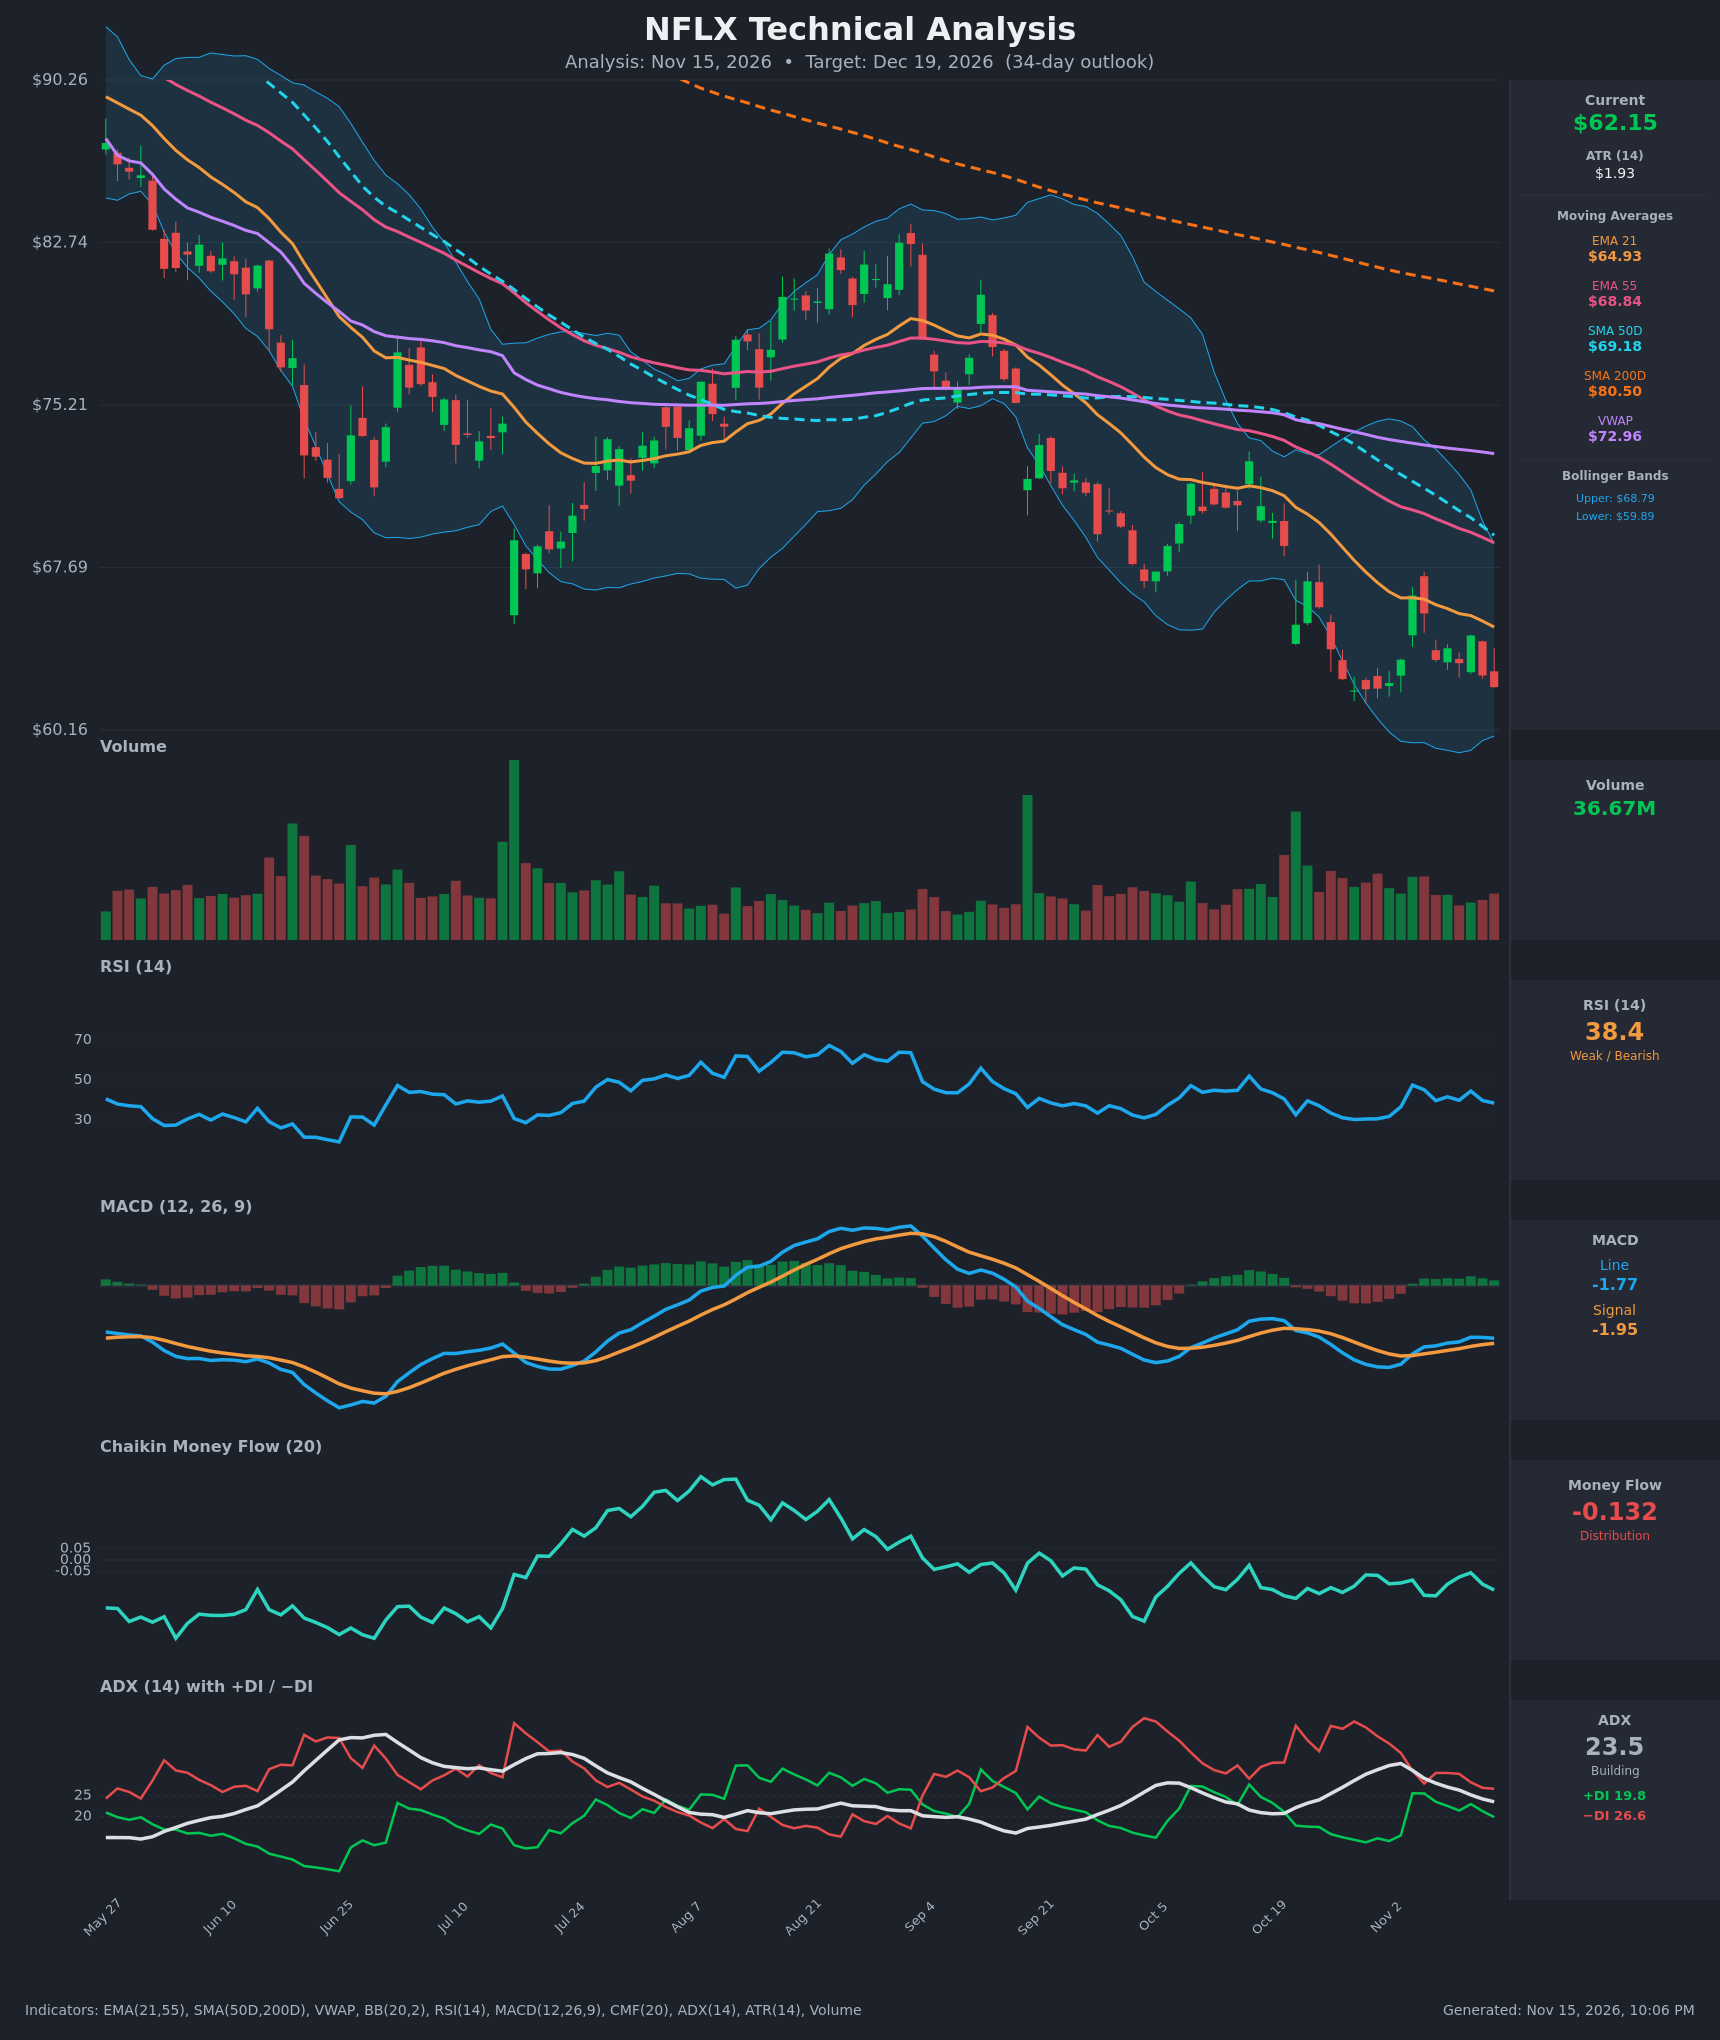
- RSI (14): 38.43, below 50 and just above oversold. It bounced from about 30 in late October to 47 on Nov 4, then rolled over to lower highs (44.5 on Nov 11, now 38.4). Momentum is weak and fading. [Bearish]
- 20 EMA: The 21 EMA is $64.93 and price ($62.15) is below it, with the EMA still sloping down. It has been resistance on every bounce, and the Nov 4 close at $66.39 only briefly poked above it. [Bearish]
- MACD: Line -1.774 vs. signal -1.945, so the line is slightly above the signal and the histogram is marginally positive (+0.17). The line has been flattening, but both lines are deeply negative and the line was -1.74 on Nov 11, so the bullish crossover is losing momentum. This is a weak, low-conviction bounce within a downtrend. [Neutral]
- Bollinger Bands (20): Upper $68.79, lower $59.89, so the midline is about $64.34. Price sits in the lower third of the bands, about $2.3 above the lower band. The bands are narrowing after the October selloff, which points to consolidation near the lows. The midline (about $64.3) is the first resistance. [Bearish]
- CMF (20): -0.132, well below -0.05 and staying negative for weeks without any sign of accumulation. Selling pressure is persistent. [Distribution]
- ADX (14): 23.5 and falling from a 32.7 peak. −DI (26.6) is above +DI (19.8). The trend is moderate and weakening, with bears still in control, though the DI gap has narrowed from the 40+ levels seen in late October. [Weak/Moderate Trend – Bearish]
- Volume: 36.67M, near average with no climactic capitulation. The spike of late October did not mark a clear bottom. Volume on the Nov 4 bounce was not followed through. [Neutral to Bearish – no accumulation confirmation]
Moving average structure is bearish. Price is below the EMA21 ($64.93), EMA55 ($68.84), SMA50D ($69.18), VWAP ($72.96) and SMA200D ($80.50). The EMA21 is below the EMA55, and the SMA50D is below the SMA200D (death cross already in place). The SMA50D and EMA55 are sloping down, which keeps overhead resistance stacked.
DIVERGENCES & TRENDS
- No clear bullish divergence in price: Price made a new low around $61.99 (Oct 28) and later retested near $62.15. RSI bottomed around 30 at the first low and sits at 38 now, a mild higher-low in RSI. This is not a strong divergence, and the lower RSI highs argue against it.
- MACD: It made a small bullish crossover with a flat histogram. It has not been able to cross above zero, and the line has stalled.
- CMF: It remains negative and has no sign of turning, which disagrees with any bullish divergence idea.
- ADX/DI: ADX is falling from 32.7 as −DI recedes from 40+. This suggests the downtrend is losing steam and may be transitioning into a range, but the −DI still leads and no bullish DI cross has occurred.
- Trend: Lower highs and lower lows since the late-August peak near $83, a clear sequence of lower highs (about $83, $71, $66.4).
- Crossovers: The death cross (SMA50D below SMA200D) is in place, and the EMA21 is below the EMA55.
CHART PATTERNS
- Descending/Bearish consolidation near the lows: Price has been grinding around $62–$66 for the past two weeks beneath falling moving averages. This resembles a Bearish Flag/Pennant (continuation) after the sharp October drop, with a support floor near $61.99–$62.
- Lower highs series (Aug–Nov): It resembles a long descending structure. A break below $61.99 would project a measured move toward about $57–$58 (the height of the consolidation from the Oct drop is roughly $4–$5).
- Possible bullish alternative (Double Bottom): The Oct 28–Nov 13 lows near $62 form a minor double bottom, with the neckline near $66.39. It would need a close above about $66.4 on volume, and nothing in CMF or ADX confirms it yet. The target would be about $70.
- Overall, the bearish continuation reading carries more weight given CMF, DI and the moving average stack.
POTENTIAL SCENARIOS
- Scenario 1: Bearish Continuation Breakdown — Price fails at the EMA21/Bollinger midline (about $64–$65) and breaks the $62 support floor, with the lower band near $59.9 as the first target. Trigger: daily close below $61.99. Target: $57.50–$59.00. Invalidation: close above $66.40. (50% probability)
- Scenario 2: Neutral Range-Bound Chop — Price stays between $60 and $66 as ADX fades and the bands narrow, with price drifting around the lower half. Trigger: failures at $65–$66 and buyers defending $60–$62. Target: $61–$65. Invalidation: close outside $59.5–$66.5. (28% probability)
- Scenario 3: Bullish Relief Rally / Double Bottom — A bounce over the EMA21 and $66.39 neckline, driven by the positive MACD cross and falling ADX, pushes price up to the EMA55/SMA50D zone. Trigger: close above $66.40 with rising volume and CMF turning toward zero. Target: $68.80–$69.20. Invalidation: close below $61.99. (22% probability)
PRICE TARGETS
- Target Price: $60.50 (34-day horizon, Dec 19, 2026)
- Expected Range: $54.50 to $67.00 (width $12.50, about 20% of the current price, consistent with the 30–60 day guidance, widened slightly because the 34-day horizon sits at the upper end of that bucket)
- Key Levels: Support at $59.89 (lower Bollinger Band, with $57.50 below it), Resistance at $64.93 (EMA21, then $66.39)
OVERALL BIAS
OVERALL BIAS: BEARISH - Price is below every major moving average, with a death cross in place, CMF at -0.132 (persistent distribution), −DI above +DI and RSI making lower highs. The MACD and ADX fade suggest a slower grind, so the target is a moderate move lower rather than a collapse. A close above $66.40 would invalidate the call.
This is educational analysis and not financial advice.