NFLX 20-day bearish forecast — Nov 15, 2026
- Bias: Bearish
- Timeframe: 20 days (made Nov 15, 2026, target date Dec 4, 2026)
- Price at analysis: $62.15
- Price target: $60.50
- Expected range: $56.50 – $64.50
- Result: Pending — graded after the close on Dec 4, 2026
Get a free AI analysis of NFLX today
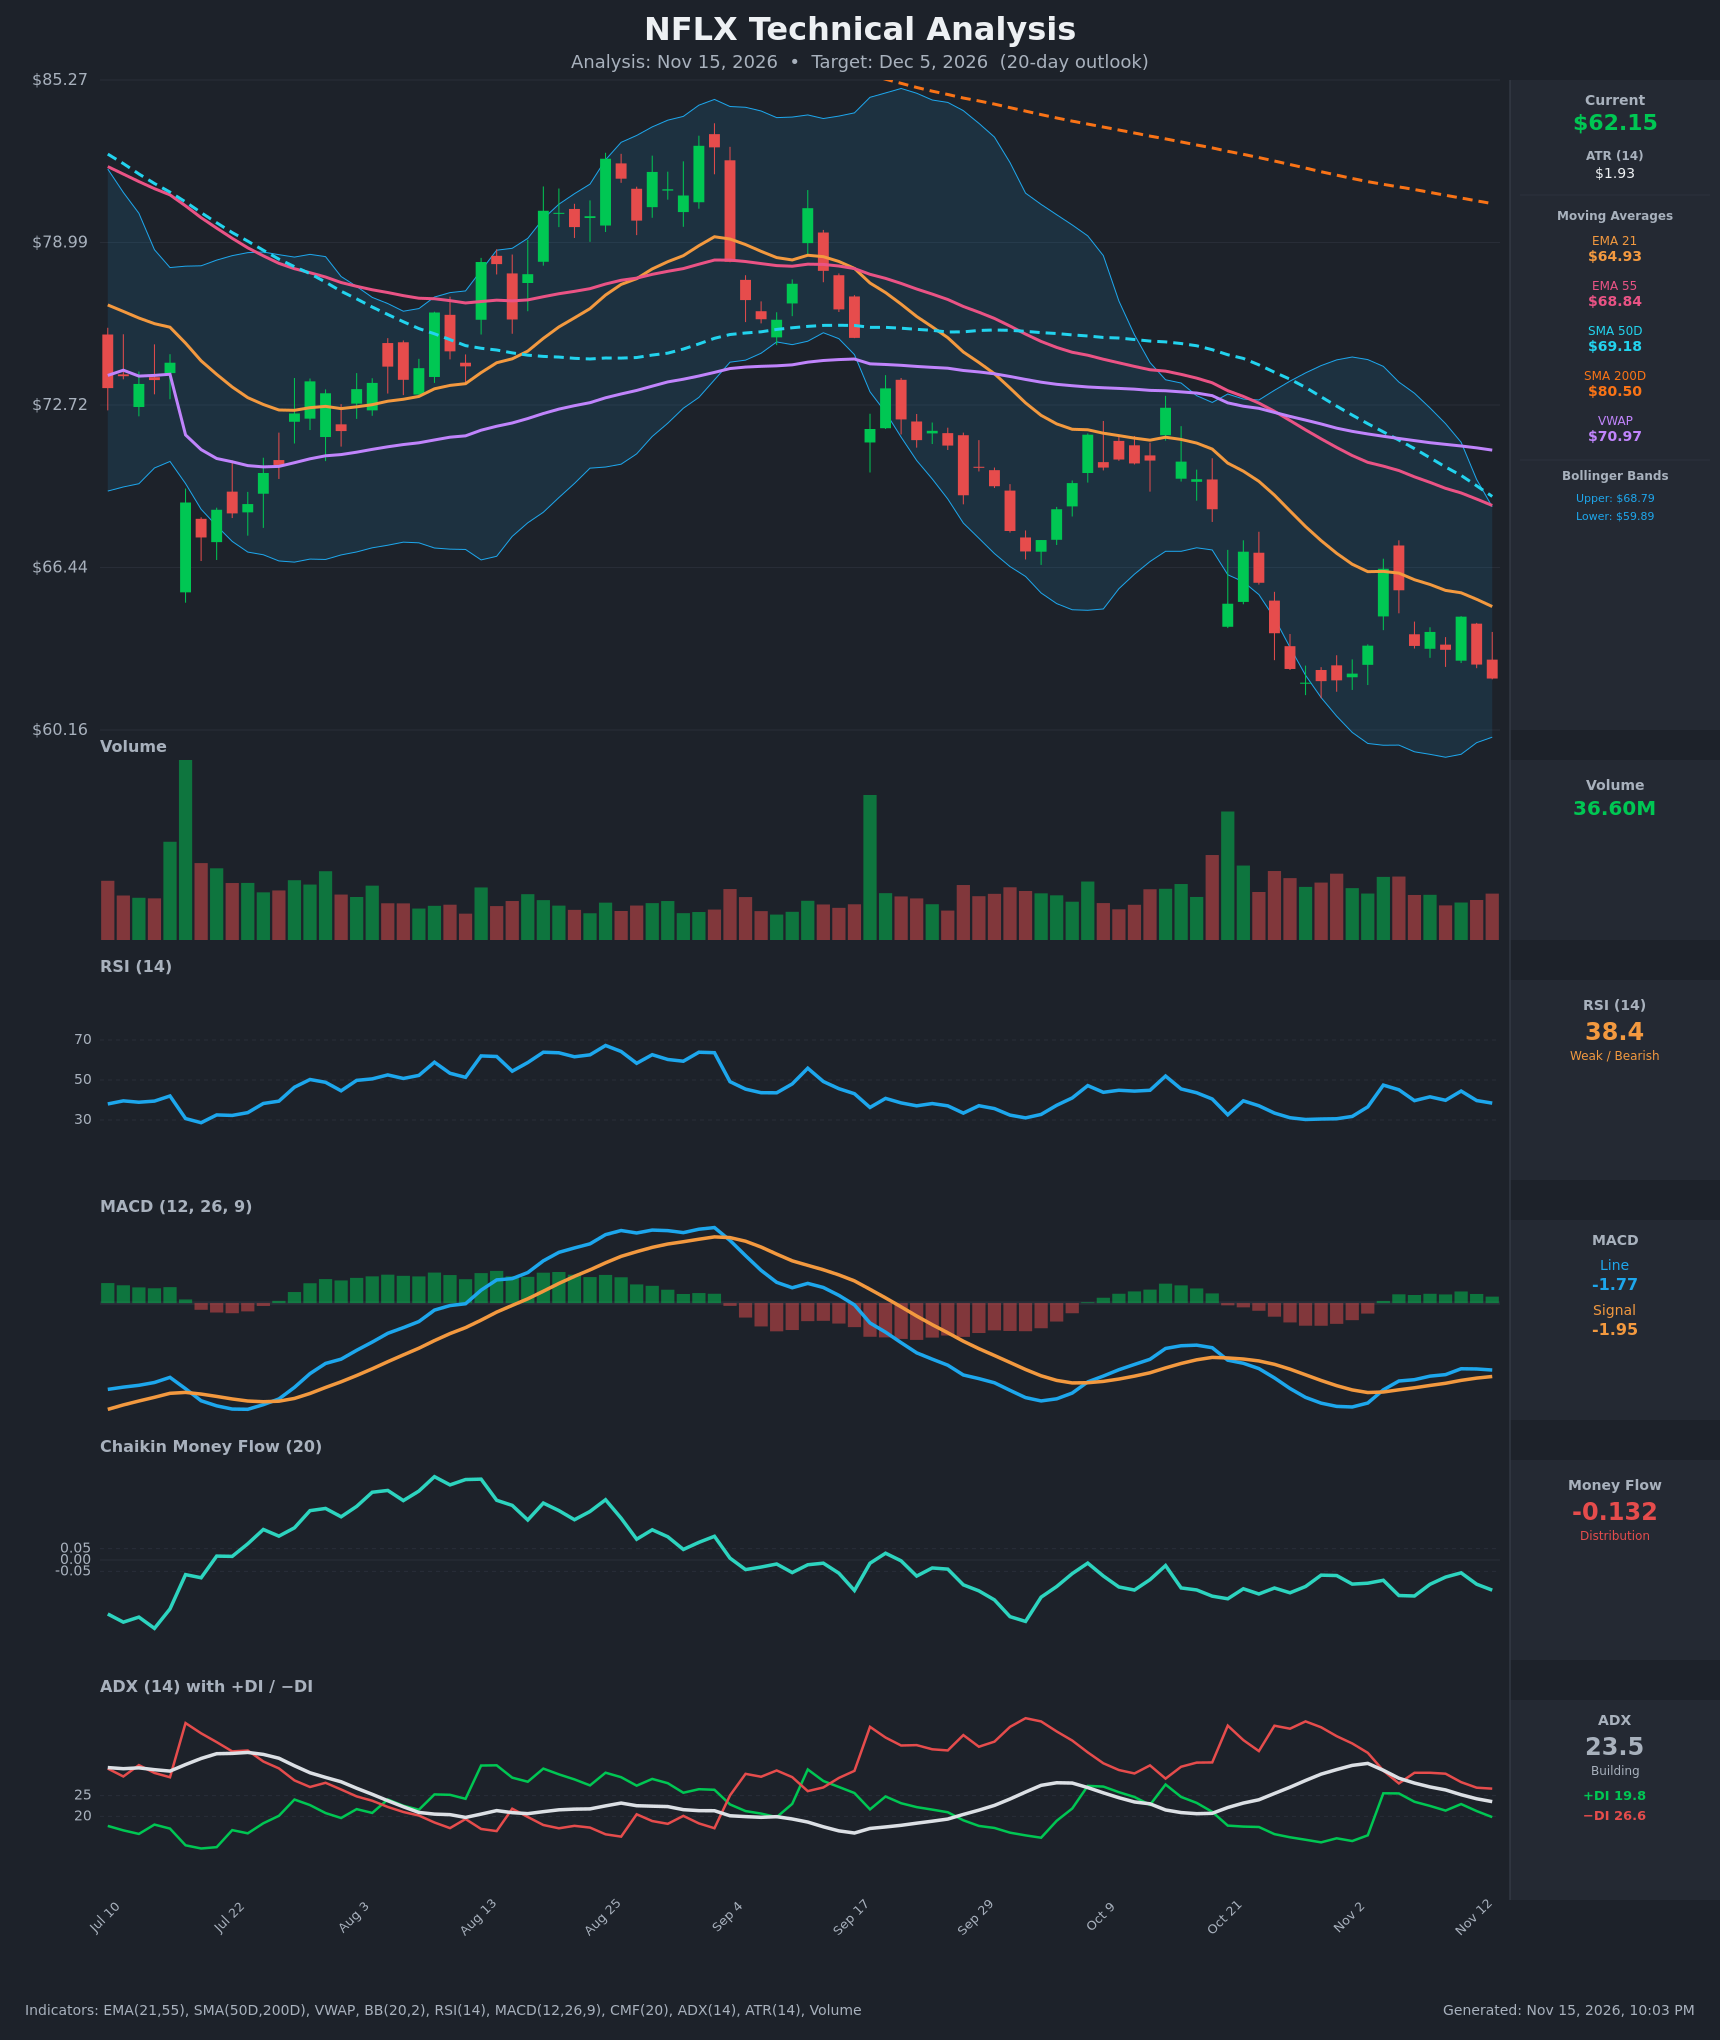
Analysis
TECHNICAL INDICATORS
- RSI (14): 38.43, in the weak zone below 50 but above oversold (30). It bounced from about 30 in late October to 47 on Nov 4, then rolled over to 38. Lower highs show momentum fading again. [Bearish]
- 20 EMA: The nearest EMA is the 21 EMA at $64.93. Price at $62.15 is below it, and the EMA keeps sloping down (EMA21 $64.93 < EMA55 $68.84). Price has been rejected near it several times (Nov 4 to Nov 12). [Bearish]
- MACD: Line -1.774 is above Signal -1.946, a mild bullish crossover that occurred around Nov 4. Both lines are negative, and the line has flattened and started rolling back down (-1.74 to -1.77). The histogram is slightly positive (+0.17) but shrinking. This is a weak, fading bullish cross inside a bearish regime. [Neutral]
- Bollinger Bands (20): Upper $68.79, lower $59.89, mid-band around $64.3. Price at $62.15 is in the lower half, below the midline, with the bands starting to contract after the October decline. There is room to the lower band (about $2.30 away) without being at an extreme. [Bearish]
- CMF (20): -0.132, well below -0.05 and negative for the whole recent stretch. It is not recovering, which points to persistent distribution. [Distribution]
- ADX (14): 23.5 and falling from 32.7 on Nov 3, so the downtrend is losing some strength but is still near trend-grade. −DI (26.6) is above +DI (19.8), so bears remain in control, though the gap has narrowed from about 27 points to about 7. [Weak/Moderate Trend – Bearish]
- Volume: 36.60M, near average with no capitulation spike. The Nov 4 bounce came on only moderate volume, and the Oct 21 high-volume breakdown has not been reversed. Down moves still have more conviction than the rebounds. [Neutral to mildly Bearish]
DIVERGENCES & TRENDS
- Moving average stack: Price ($62.15) < EMA21 ($64.93) < EMA55 ($68.84) < SMA50D ($69.18) < SMA200D ($80.50) < VWAP ($70.97) all sit above price. This is a fully bearish alignment.
- Death cross: SMA50D is well below SMA200D, a long-term bearish regime. The 50D is now curling down and heading toward price.
- EMA trend: EMA21 is below EMA55 and the gap is widening (about $3.90 now vs about $3.20 on Nov 4), so there is no bullish crossover on the horizon.
- RSI: Price made lower lows in late October (about $61.99) and has since held a similar area, while RSI bottomed near 30 and now sits at 38. There is no confirmed bullish divergence, only a shallow one-time bounce that failed at the EMA21.
- MACD: The bullish cross is losing steam, since the line fell back from -1.74 to -1.77. A bearish re-cross is possible if price breaks down.
- DI/ADX: −DI stays above +DI, and the narrowing gap shows downside momentum is fading rather than reversing.
- Price structure: Since late October price has been bouncing in a range of about $61.7 to $66.4, with the Nov 4 spike failing at about $66.4. Lower highs persist since September.
CHART PATTERNS
- Bearish trend with a possible Bearish Flag/Pennant (continuation): After the sharp drop from about $72 to $62, the sideways-to-upward drift from $61.7 to $66.4 resembles a bearish flag. A break below about $61.7 would project roughly $57 to $58 (flag-pole measure).
- Possible Bullish Falling-Wedge/Double-Bottom (reversal): Price tested about $61.7 to $62 twice (Oct 28 to 30 and now), forming a potential double bottom with a neckline near $66.4. This needs a close above $66.4 on volume to confirm, and the target would be about $70. Right now it is unconfirmed, and the weak CMF and failed rallies argue against it.
- The bearish continuation read has the edge given the moving average stack and distribution.
POTENTIAL SCENARIOS
- Scenario 1: Bearish Support Break and Continuation Lower — Price fails at the EMA21 (about $64.9), breaks the $61.7 double-bottom support, and drifts toward the lower Bollinger Band as −DI stays dominant and CMF remains negative. Trigger: daily close below $61.70. Target: $58.00 to $59.00. Invalidation: daily close above $65.00 to $66.40. (50% probability)
- Scenario 2: Neutral Range Consolidation — Price chops between $60.50 and $65.00 as ADX fades and MACD flattens. Trigger: holding $61.70 with rejection near the EMA21. Target: $61.00 to $64.00. Invalidation: close outside $60.50 to $65.50. (30% probability)
- Scenario 3: Bullish Double-Bottom Reversal — The $62 area holds a second time and buyers push through the EMA21 and $66.40 neckline, with a mean reversion toward the 50D SMA and VWAP. Trigger: close above $66.40 with volume expansion and CMF turning positive. Target: $69.00 to $70.00. Invalidation: close back below $62.00. (20% probability)
PRICE TARGETS
For a 20-day timeframe, the range width should be roughly 8 to 12% of the current price, so I'm using about 12% (just inside the 14-21 day band).
- Target Price: $60.50 (20-day horizon)
- Expected Range: $56.50 to $64.50 (width $8.00, about 12.9% of $62.15, consistent with the 14-21 day guidance given ATR of about $1.93)
- Key Levels: Support at $59.89 (lower Bollinger Band; below it, $57.00), Resistance at $64.93 (EMA21; above it, $66.40)
OVERALL BIAS
OVERALL BIAS: BEARISH - Price is below every major moving average, in a death-cross regime, with persistent distribution (CMF -0.132), −DI above +DI, and a fading RSI/MACD bounce that failed at the EMA21. The weakening ADX and potential double bottom near $62 limit conviction, but the evidence favors a retest and break of support toward about $60.50.
This is educational analysis and not financial advice.