NFLX 83-day bearish forecast — Nov 15, 2026
- Bias: Bearish
- Timeframe: 83 days (made Nov 15, 2026, target date Feb 5, 2027)
- Price at analysis: $62.15
- Price target: $58.50
- Expected range: $52.00 – $69.00
- Result: Pending — graded after the close on Feb 5, 2027
Get a free AI analysis of NFLX today
Analysis
TECHNICAL INDICATORS
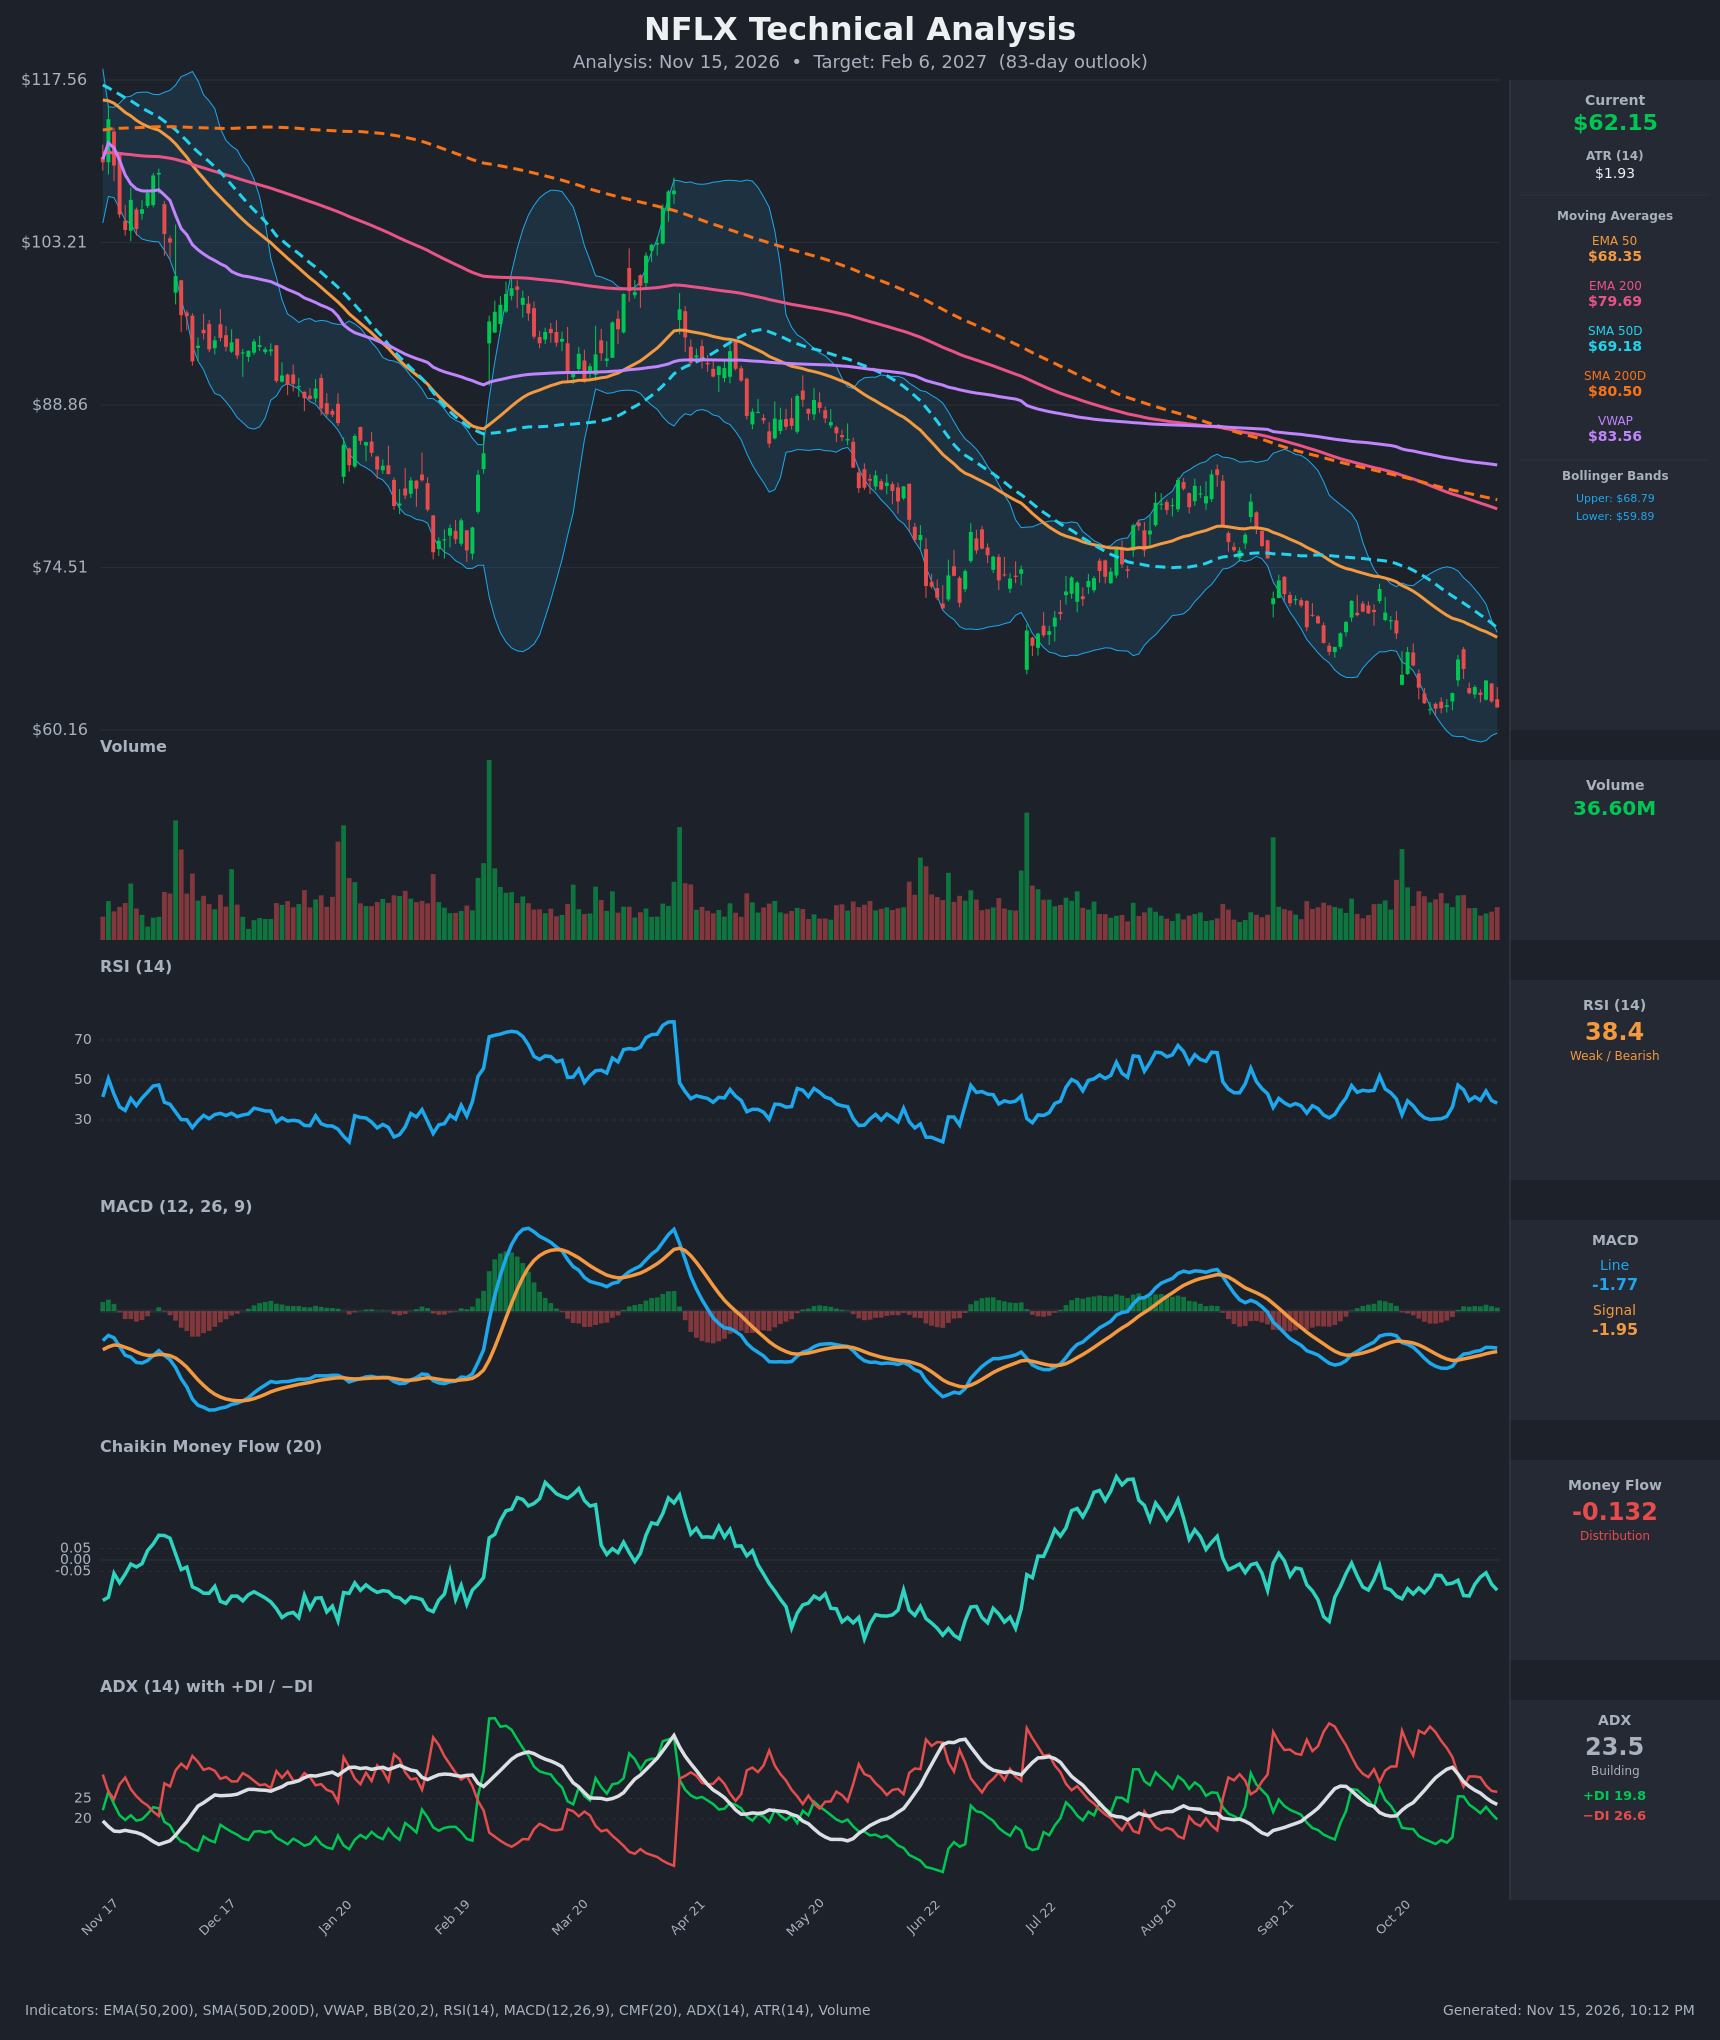
- RSI (14): 38.43, below the 50 midline and just above the oversold 30 zone. It bounced from ~30 in late October to the 45 area, then rolled over again (44.5 → 38.4). Momentum is weak with no bullish divergence yet. [Bearish]
- 20 EMA: The 20 EMA isn't supplied. Using the EMA 50 at $68.35 as a proxy, price at $62.15 sits about 9% below it, and the EMA 50 is still falling. The mid-term average acts as overhead resistance. [Bearish]
- MACD: Line -1.774 vs signal -1.946, so the histogram is slightly positive (+0.17). The line crossed above the signal around Nov 4 and is still above it, but both are deeply negative and the line has stalled. This is a mild momentum improvement inside a downtrend, not a trend reversal. [Neutral]
- Bollinger Bands (20): Upper $68.79, lower $59.89, mid ≈ $64.34. Price at $62.15 is in the lower half, about 25% of the band width above the lower band. The bands are moderately wide after the recent walk down the lower band. Price below the mid-band signals weakness. [Bearish]
- CMF (20): -0.132, well below -0.05 and negative for most of the recent period, with no sustained accumulation. Selling pressure persists. [Distribution]
- ADX (14): 23.5, falling from a 32.7 peak, with −DI (26.6) above +DI (19.8). The trend is fading in strength but still bearish. The +DI/−DI gap has narrowed from 41 vs 14 in late October, so selling pressure is easing. [Moderate Trend, Bearish direction]
- Volume: 36.60M, near average with no capitulation spike on the recent lows. Up days (Nov 4) show only modest expansion. This signals a lack of strong conviction from either side and no clear washout bottom. [Neutral to Bearish]
DIVERGENCES & TRENDS
- Moving averages: Price ($62.15) is below EMA 50 ($68.35), SMA 50D ($69.18), EMA 200 ($79.69), SMA 200D ($80.50) and VWAP ($83.56). All are falling. The death cross (SMA50D below SMA200D) is long established, and the EMA 50 is also below the EMA 200. This is a mature, entrenched downtrend with a lower-high, lower-low structure.
- Possible mild positive divergence: Price made new lows in late October to November while MACD and RSI made higher lows (MACD -2.75 → -1.77). This is a mild bullish divergence, but RSI has not confirmed with a break above 50.
- ADX/DI: −DI has been on top since late October. +DI briefly tied −DI on Nov 4–5 and has since slipped back, a failed bullish attempt.
- Price vs. lower Bollinger Band: Price has been hugging the lower band; the failure to bounce back above the mid-band (~$64.3) keeps sellers in control.
CHART PATTERNS
- Dominant structure: A long-running descending channel with a series of lower highs and lower lows, closest to the continuation theme of the Descending Triangle / Bearish Flag family. Each rally since June has been sold at falling moving averages.
- Recent consolidation: The ~$62–$66.5 range over the last three weeks looks like a small bearish flag/pennant after the October drop. A breakdown below ~$61.5 would project a measured move of roughly the prior leg (~$8–10), giving about $52–$54.
- Bullish alternative: A Bullish Falling Wedge / Double Bottom is possible if $60–$62 holds, supported by the MACD higher lows. Confirmation would need a close above ~$66.5 and the EMA 50 (~$68). The bearish pattern is currently more likely.
POTENTIAL SCENARIOS
- Scenario 1: Bearish Continuation Breakdown — The consolidation resolves lower, with distribution (CMF -0.13), −DI dominance and all MAs sloping down. Price loses the $60 area and trends toward the mid-$50s over the next 83 days. Trigger: daily close below $59.90 (lower BB) and $60 round-number support. Target: $53–$56. Invalidation: daily close above $68.5 (EMA 50). (50% probability)
- Scenario 2: Neutral Range Base — Price stabilizes between roughly $58 and $68 as selling exhausts and ADX drops below 20, with oscillation around the mid-Bollinger band. Trigger: holds $59–$60 on repeated tests with declining volume. Target: $60–$65. Invalidation: close below $58 or above $69. (28% probability)
- Scenario 3: Bullish Mean-Reversion Rally — The MACD higher low and oversold-area RSI fuel a relief rally toward the falling EMA 50/SMA 50D cluster. Trigger: close above $66.5 on rising volume with RSI above 50. Target: $69–$72. Invalidation: close back below $62. (22% probability)
PRICE TARGETS
For the 83-day horizon (Feb 6, 2027), the range width should be roughly 18–30% of price. The expected range is $52.00 to $69.00, a width of $17.00 (27.4%), which fits the guidance.
- Target Price: $58.50 (down ~5.9% from $62.15, reflecting the trend and distribution, tempered by mean-reversion potential)
- Expected Range: $52.00 to $69.00
- Key Levels: Support at $59.89 (lower Bollinger Band; below it, $55.00 is the next psychological level), Resistance at $68.35 (EMA 50, with the SMA 50D at $69.18 just above)
OVERALL BIAS
OVERALL BIAS: BEARISH - Price is below every major moving average in a mature downtrend (death cross, −DI > +DI, CMF -0.13 distribution, RSI < 40). The MACD improvement and narrowing DI gap argue for a bounce, but these are not enough to override the structure of lower highs and lower lows.
This is educational analysis and not financial advice.