NFLX 4-day bullish forecast — Nov 1, 2026
- Bias: Bullish
- Timeframe: 4 days (made Nov 1, 2026, target date Nov 4, 2026)
- Price at analysis: $62.08
- Price target: $62.60
- Expected range: $60.80 – $63.50
- Result: Correct (+6.9%) — closed at $66.39 on Nov 4, 2026; quality score 50/100
Get a free AI analysis of NFLX today
Analysis
TECHNICAL INDICATORS
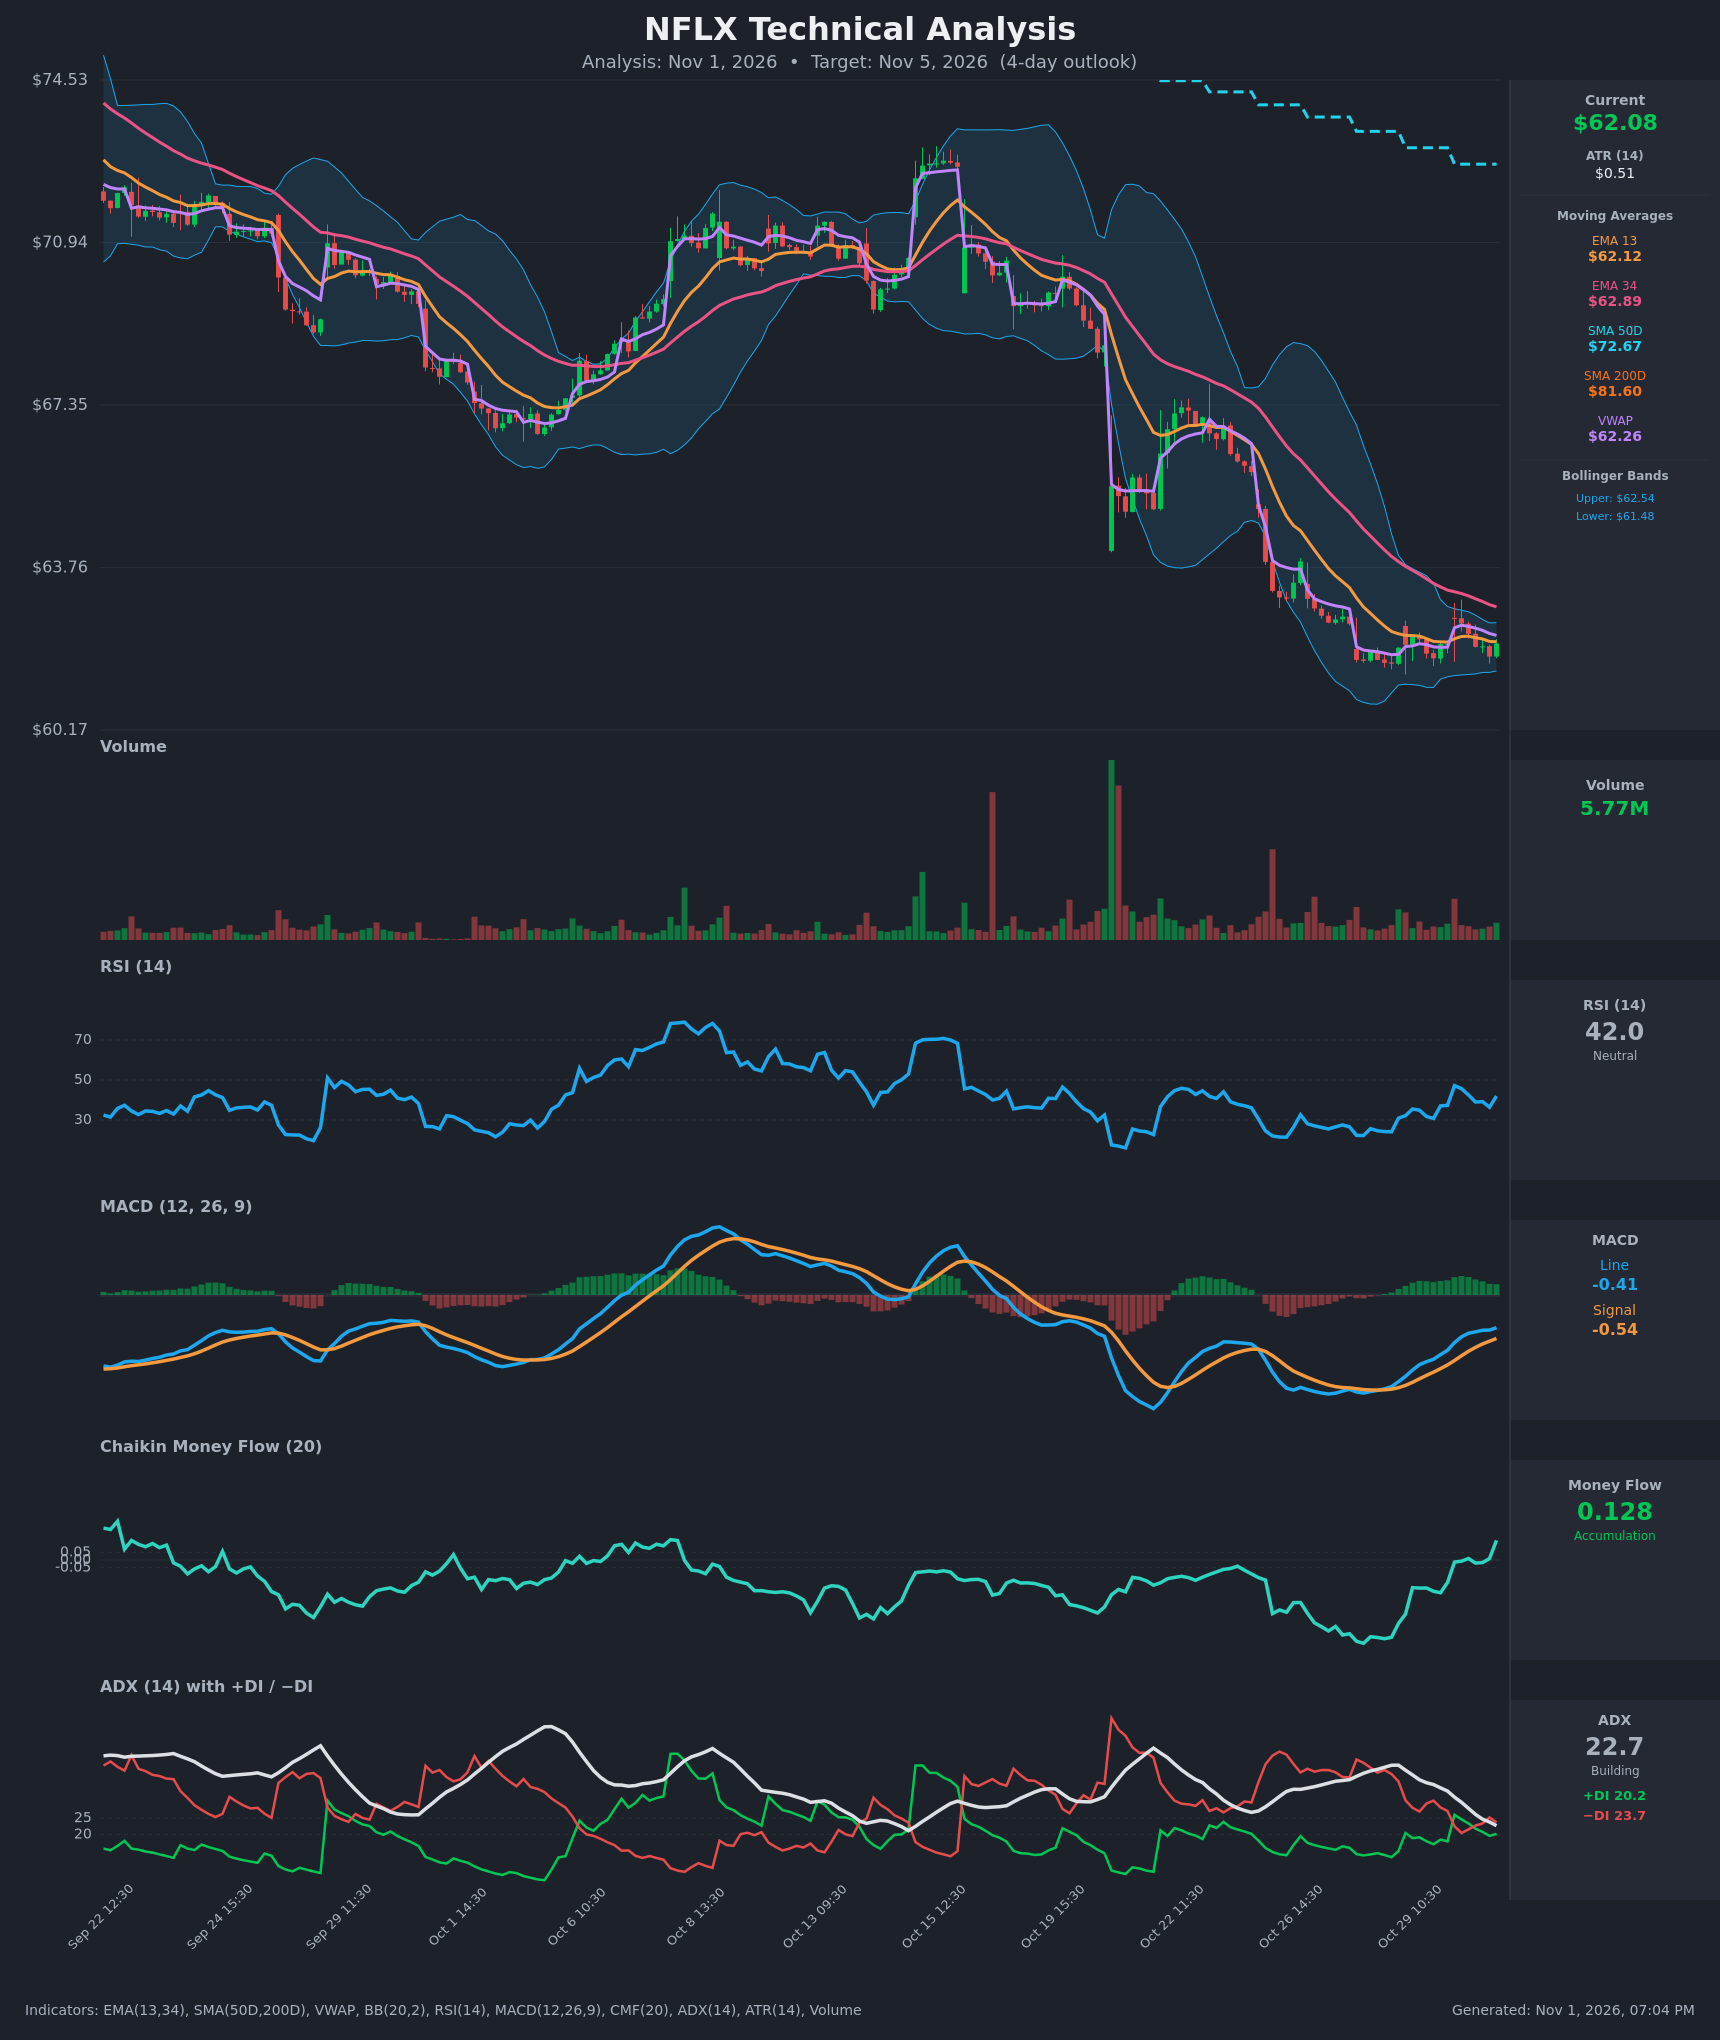
- RSI (14): 42.01, up from 30.8 at the Oct 29 low. It has bounced off oversold but is still below 50, and it has been capped around 45-47 on each attempt. Momentum is improving but not yet bullish. [Neutral]
- 20 EMA (EMA 13 / EMA 34 used): EMA 13 is $62.12 and the price of $62.08 sits just below it, a marginal rejection. EMA 34 is $62.89, overhead and still falling. The 13 is below the 34, which is a bearish stack. Price is hugging the short EMA, so it is neither clear support nor clear resistance yet. [Bearish]
- MACD: Line -0.41 vs Signal -0.54, so the line is above the signal and the histogram is positive (+0.13) and widening. The line crossed above the signal around Oct 29-30. This is a bullish momentum cross, but it happens below zero, so it is only a relief-rally signal. [Bullish]
- Bollinger Bands (20): Upper $62.54, lower $61.48, middle about $62.01. Price is just above the midline. The bands are very narrow after the October selloff, a volatility squeeze that points to an expansion soon. Direction is not set by the squeeze itself. [Neutral]
- CMF (20): +0.128, up from -0.41 on Oct 28 and well above +0.05. Money flow has swung to accumulation at the lows, a constructive sign. [Accumulation]
- ADX (14): 22.7 and falling from 41.2, with −DI 23.7 above +DI 20.2. The −DI lead is shrinking (it was 36 vs 15). The downtrend is losing strength and the market is drifting toward range conditions, but bears still hold a slight edge. [Weak Trend, bearish lean]
- Volume: 5.77M, low and fading during the consolidation, with no capitulation spike and no expansion on bounces. The market is waiting for a catalyst. Price is also slightly below VWAP ($62.26), a mild seller edge. [Neutral/Indecisive]
DIVERGENCES & TRENDS
- Bullish divergence: Price made new lows around $61.4-61.8 while RSI, MACD and CMF all made higher lows. CMF in particular turned from -0.41 to +0.13.
- MACD crossover: The MACD line crossed above the signal line. The histogram is positive and expanding.
- Longer-term trend is bearish: Price is far below SMA50D ($72.67) and SMA200D ($81.60), and SMA50D is under SMA200D (death cross in effect). The EMA 13 / EMA 34 stack is bearish, with EMA 13 still below EMA 34, though the gap narrowed from $1.59 to $0.77.
- ADX decay: The fall in ADX from 41 to 22.7 shows the selling impulse is exhausting. The DI lines are converging and a +DI/−DI crossover is close.
- VWAP: Price is slightly below VWAP ($62.26) and EMA 13, so the immediate reclaim zone is $62.12-$62.26.
CHART PATTERNS
- Falling wedge / base (bullish reversal): Price has compressed into a tight, slightly downward-to-flat range with higher momentum lows. This is a Bullish Falling Wedge-style setup. A breakout above roughly $62.55-$62.90 would target the $63.50-$64.00 area.
- Bearish pennant (continuation, alternative reading): The tight consolidation after a sharp drop could also be a Bearish Pennant. A break below $61.40 would project toward $60.20-$60.50, since the prior drop was large.
- Both readings are live. Momentum and money flow favor the bullish resolution in the short term, while the larger trend favors the bearish one.
POTENTIAL SCENARIOS
- Scenario 1: Bullish Relief Bounce to EMA 34 — Momentum divergences and CMF accumulation drive a squeeze breakout above the upper Bollinger Band. Price reclaims EMA 13 and VWAP and tests the falling EMA 34. Trigger: hourly close above $62.55 on rising volume. Target: $62.90-$63.50. Invalidation: close back below $61.48. (45% probability)
- Scenario 2: Bearish Continuation Breakdown — The consolidation fails as a bearish pennant. The −DI lead holds, price loses the lower band and the overall downtrend resumes. Trigger: hourly close below $61.45. Target: $60.50-$60.80. Invalidation: close above $62.90 (EMA 34). (35% probability)
- Scenario 3: Neutral Chop in the Squeeze — Price oscillates inside the narrow Bollinger range with low volume and no decisive break. Trigger: failure to close outside $61.48-$62.54. Target: $61.70-$62.40. Invalidation: any decisive close outside that range. (20% probability)
PRICE TARGETS
- Target Price: $62.60 (4-day, Nov 5, 2026)
- Expected Range: $60.80 to $63.50 (width $2.70, about 4.3% of current price, appropriate for a 4-day window)
- Key Levels: Support at $61.48 (lower Bollinger Band and recent lows), Resistance at $62.89 (EMA 34)
OVERALL BIAS
OVERALL BIAS: BULLISH - A MACD bullish crossover, CMF swinging to strong accumulation (+0.128) and bullish momentum divergences at the lows, together with a fading ADX, favor a modest relief bounce toward the EMA 34 area. Conviction is limited because price remains below all major moving averages and −DI still leads.
This is educational analysis and not financial advice.