AAPL 4-day bearish forecast — Nov 1, 2026
- Bias: Bearish
- Timeframe: 4 days (made Nov 1, 2026, target date Nov 4, 2026)
- Price at analysis: $344.79
- Price target: $342.40
- Expected range: $338.00 – $351.00
- Result: Incorrect (+1.4%) — closed at $349.51 on Nov 4, 2026; quality score 49/100
Get a free AI analysis of AAPL today
Analysis
TECHNICAL INDICATORS
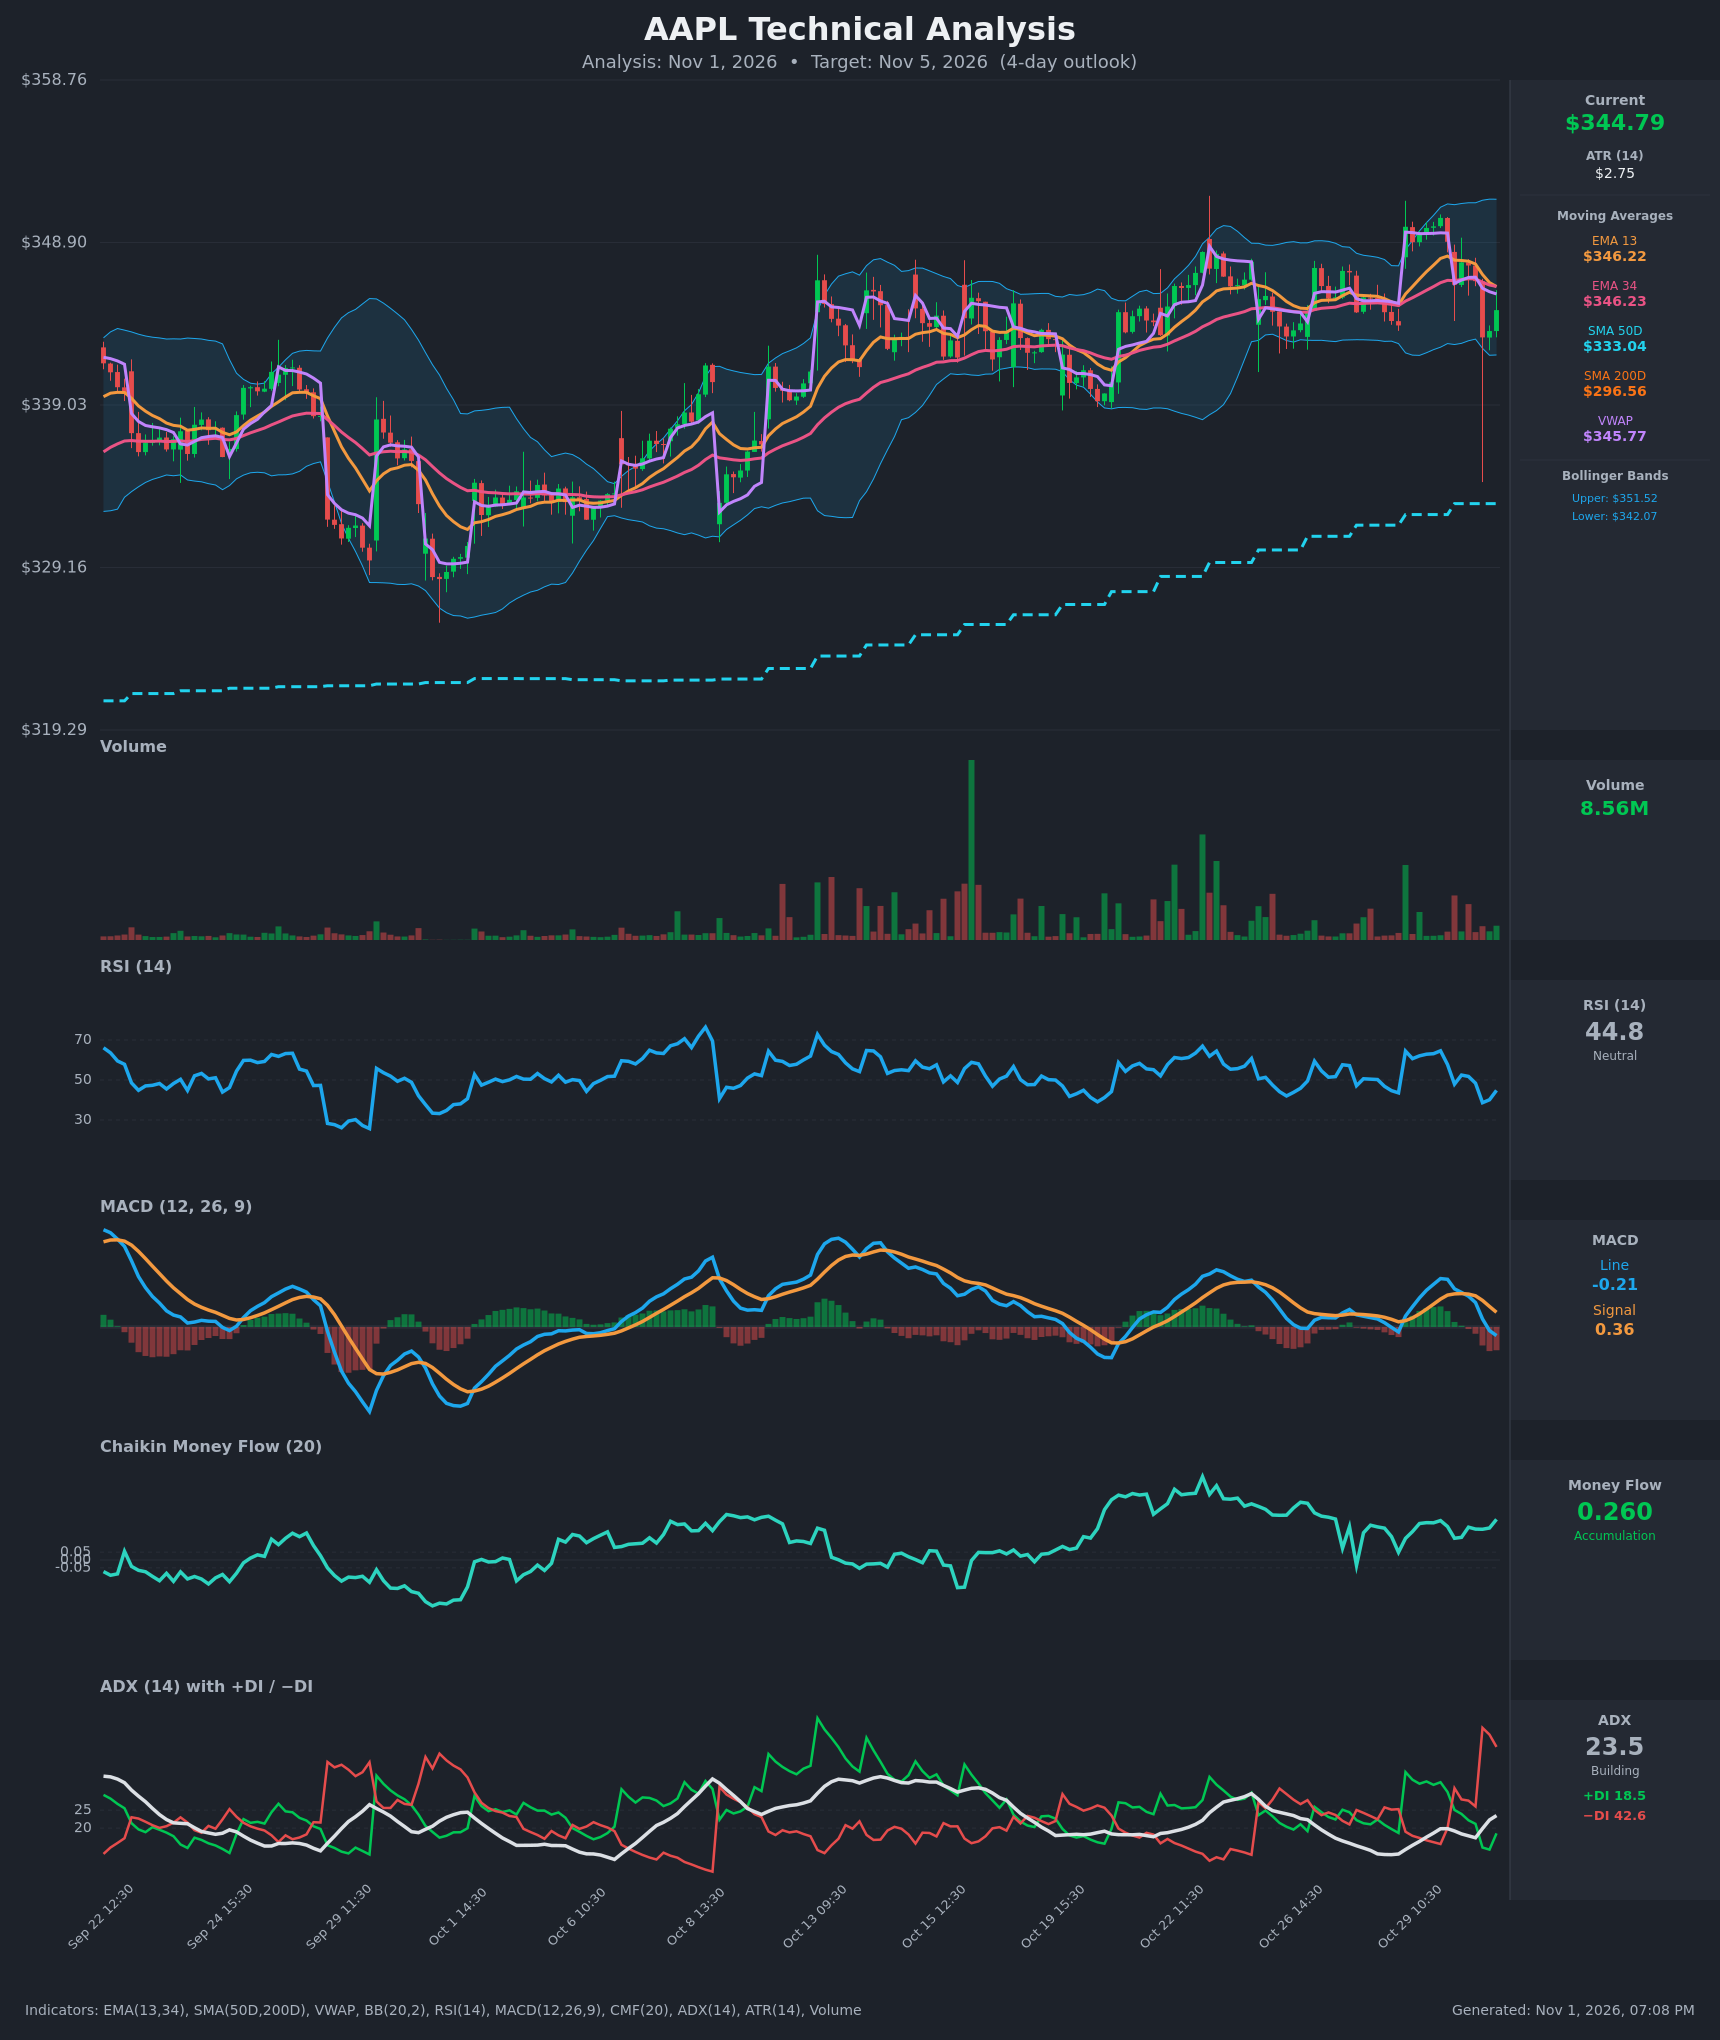
- RSI (14): 44.80, recovering from 38.7 two bars earlier but still below 50. It sits in neutral-to-weak territory after falling from 64.6 on Oct 29. [Neutral]
- 20 EMA: Using the EMA 13/34 pair provided, EMA13 is $346.22 and EMA34 is $346.23, essentially flat and just crossed down (EMA13 fell below EMA34 on the last bar). Price at $344.79 is below both, so they act as resistance. [Bearish]
- MACD: Line -0.21 is below signal 0.36 after a bearish crossover around Oct 30 14:30. The histogram is negative (about -0.57) and the line has just crossed below zero, but the histogram is still falling. [Bearish]
- Bollinger Bands (20): Upper $351.52, lower $342.07. Price is in the lower third of the bands, about $2.7 above the lower band, and the bands are fairly narrow, which fits a consolidation. The lower band is the nearest support. [Neutral]
- CMF (20): 0.260, well above +0.05 and positive for the whole recent window (0.14-0.26). Buying pressure is persistent, which is the main bullish counterweight. [Accumulation]
- ADX (14): 23.5 and rising from 12.8, so a trend is building. −DI (42.6) is far above +DI (18.5), so sellers control the short-term move. [Moderate Trend, Bearish direction]
- Volume: 8.56M on the last bar, modest compared with the spikes on the earlier impulsive moves. The Oct 30 selloff was heavier than the small recovery bar, so the bounce lacks conviction. [Neutral to slightly Bearish]
DIVERGENCES & TRENDS
- Money flow vs. price: CMF is high (0.26) while price made a lower high and dropped below the EMAs and VWAP. This is a mild bullish divergence in volume flow, but CMF has been flat to rising and has not confirmed the drop.
- Momentum:
- RSI fell from 64.6 to 38.7, then ticked up to 44.8.
- The MACD bearish crossover is fresh.
- −DI spiked from 26 to 48 in one bar (the Oct 30 13:30 selloff).
- Crossovers:
- EMA13 just crossed below EMA34 (short-term bearish).
- MACD crossed below signal and then below zero.
- There is no golden or death cross: SMA50 ($333.04) is far above SMA200 ($296.56), and price is above both. The long-term trend is up.
- VWAP: Price ($344.79) is below VWAP ($345.77), a mild sign of selling pressure.
- Structure: Price has traded between roughly $342 and $350 for about a week. The bounce on Oct 30 stalled below the EMA cluster.
CHART PATTERNS
- Descending Triangle / sideways channel:
- Support near $343-$342 (the lower Bollinger Band) has been tested repeatedly, with lower highs from $350.39 down through $347.69 to $344.79.
- It is not a textbook descending triangle. A close below about $342 would have a measured target near $338-$339.
- Higher-timeframe context: Price is well above the rising SMA50 and SMA200, so any breakdown is more likely a pullback within an uptrend than a reversal. SMA50 at $333 is the deeper support.
- No confirmed reversal: There is no clear Head and Shoulders or Double Top. The pattern evidence is modest.
POTENTIAL SCENARIOS
- Scenario 1: Bearish Test of Lower Band Support — Bears hold control (−DI >> +DI, MACD negative, EMAs turning down), and price is rejected at the $346 EMA/VWAP cluster. It grinds down to test or briefly break the $342 lower band. Trigger: failure to reclaim $346.2 and a close below $343.1. Target: $340-$342. Invalidation: a close above $346.5. (45% probability)
- Scenario 2: Neutral Range Hold — Strong CMF accumulation keeps buyers defending $342-$343, and price chops between $342 and $347 with weak trend follow-through. Trigger: hourly closes holding above $342.1 with RSI stabilizing near 45-50. Target: $344-$346. Invalidation: a hourly close below $342 or above $347.5. (30% probability)
- Scenario 3: Bullish Rebound Reclaim — Accumulation wins out. Price reclaims the EMA/VWAP cluster and retests the upper band area. Trigger: a close above $346.5 with a MACD re-cross up. Target: $349-$351. Invalidation: a drop back below $343. (25% probability)
PRICE TARGETS
For the 4-day horizon (target date Nov 5, 2026):
- Target Price: $342.40
- Expected Range: $338.00 to $351.00 (width $13.00, about 3.8% of the current price, which fits a 4-day window)
- Key Levels: Support at $342.07, Resistance at $346.22
OVERALL BIAS
OVERALL BIAS: BEARISH - The fresh MACD bearish crossover, EMA13 crossing below EMA34, price below both EMAs and VWAP, and −DI far above +DI with ADX rising point to near-term downside toward the $342 lower band. Strong CMF accumulation and the position above SMA50/SMA200 limit the downside, so conviction is modest.
This is educational analysis and not financial advice.