AAPL 83-day bullish forecast — Nov 15, 2026
- Bias: Bullish
- Timeframe: 83 days (made Nov 15, 2026, target date Feb 5, 2027)
- Price at analysis: $356.27
- Price target: $380.00
- Expected range: $335.00 – $410.00
- Result: Pending — graded after the close on Feb 5, 2027
Get a free AI analysis of AAPL today
Analysis
TECHNICAL INDICATORS
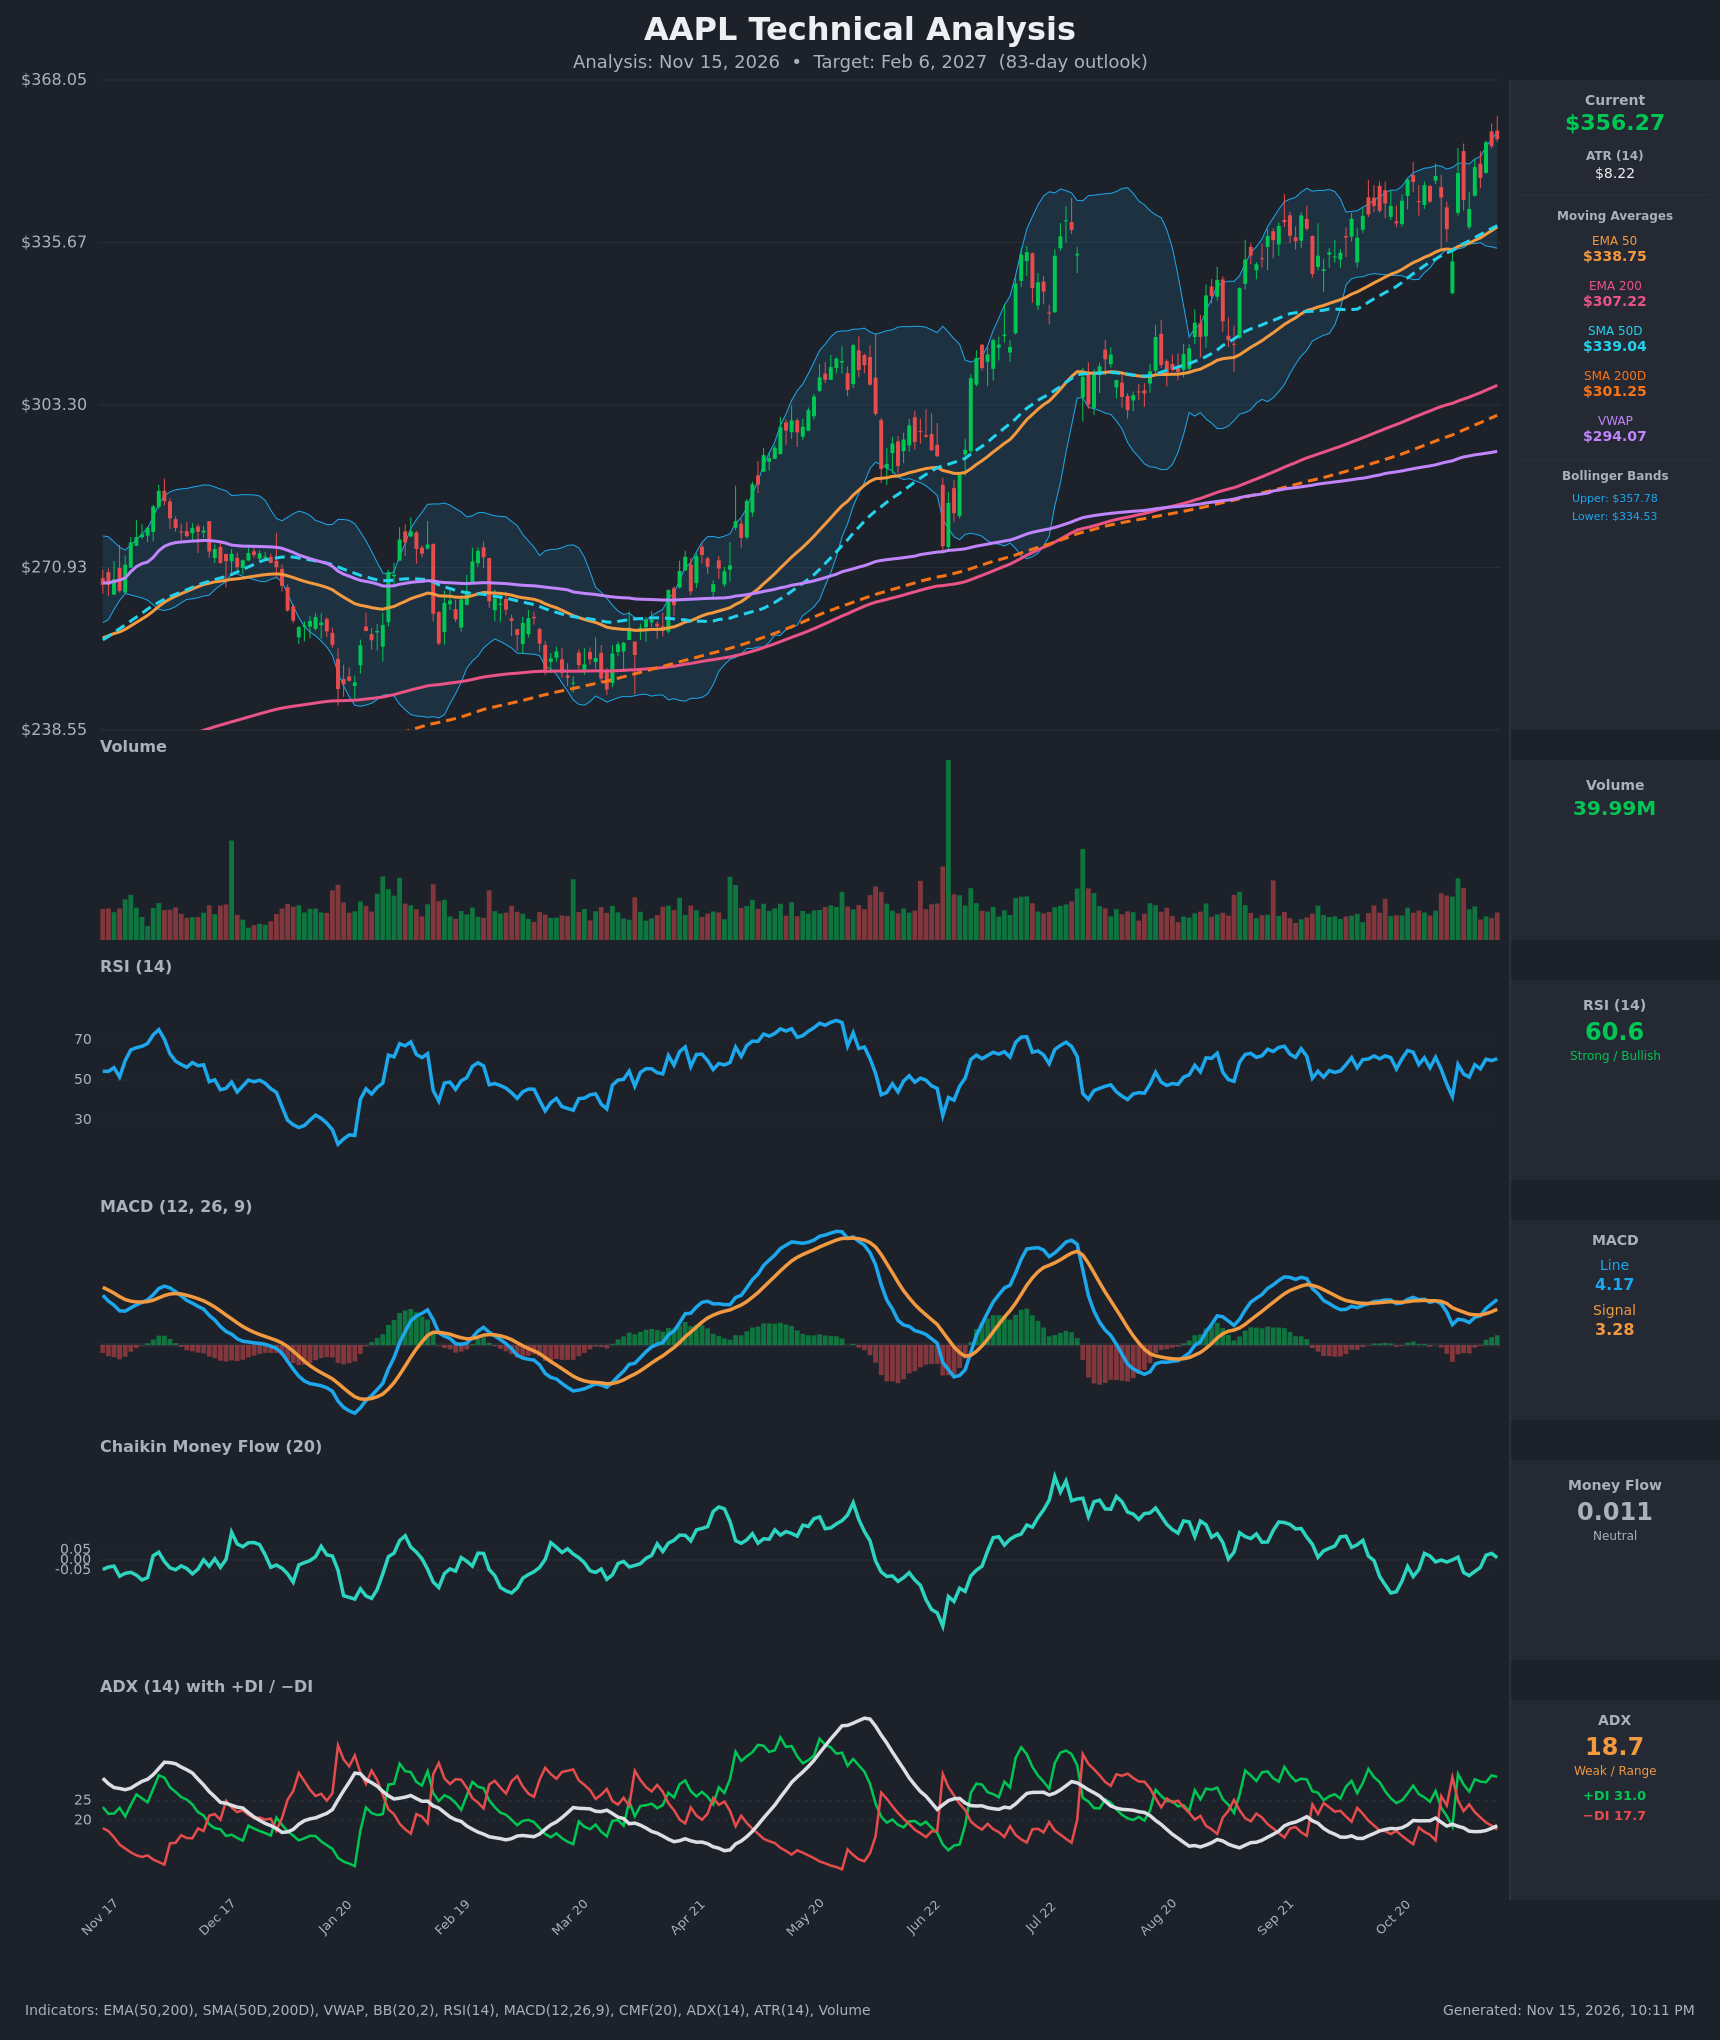
- RSI (14): 60.64, in the upper-neutral/bullish zone and well below 70. It has recovered from 41.7 on Nov 3 and held 55-61 over the last week, so momentum is firm with room before overbought. [Bullish]
- 20 EMA: The 20 EMA isn't supplied, but the 50 EMA at $338.75 is rising and sits about 5% below price. Price at $356.27 is above all short- and medium-term averages, and pullbacks toward $338-340 should find support. [Bullish]
- MACD: The line (4.17) is above the signal (3.28), with a positive and widening histogram (~+0.89). It crossed back above the signal on Nov 11 after the early-November dip. This is a fresh bullish momentum re-acceleration. [Bullish]
- Bollinger Bands (20): Price is at $356.27, hugging the upper band ($357.78), with the lower band at $334.53 and a midline near $346. Riding the upper band in an uptrend signals strength, though it is short-term stretched and prone to a reversion toward the midline. [Bullish]
- CMF (20): 0.011, inside the ±0.05 neutral band and hovering around zero. Price is making highs without accumulation backing, so buying conviction is lacking. [Neutral]
- ADX (14): 18.7, below 20, so the trend is weak or range-like in strength terms. +DI (31.0) is well above −DI (17.7), so bulls control direction, and the rising ADX over the last few bars is a modest improvement. [Weak Trend + Bullish direction]
- Volume: 39.99M, average to slightly below average, with no large-volume breakout bar on the recent push to new highs. Rallies are not heavily confirmed, but there is no distribution spike either. [Neutral to mildly supportive]
DIVERGENCES & TRENDS
- Long-term structure: The golden cross is already in place (SMA50D $339.04 > SMA200D $301.25; EMA50 $338.75 > EMA200 $307.22). Price is about 18% above the SMA200D, a confirmed long-term uptrend, and the 200-day averages are still sloping upward.
- Mild momentum non-confirmation: Price is at multi-month highs, but RSI (60.6) and MACD (4.17) are well below their spring peaks (RSI near 78, higher MACD readings). CMF is flat near zero while price climbs, and ADX is below 20. The rally is a grind rather than a thrust, a mild warning of a slower or choppier advance, not a sell signal.
- Crossovers: MACD turned back up through its signal on Nov 11. +DI is above −DI, and the DI spread widened after a brief bearish DI flip on Oct 30 – Nov 3, which was quickly reversed.
- Stretch: Price is about 5% above the 50-day averages and at the upper Bollinger Band, which makes a pullback toward $340-346 plausible without breaking the trend.
- VWAP: At $294.07, VWAP is far below price, so buyers are in the money, but it is a distant reference, not near-term support.
CHART PATTERNS
- Ascending channel with higher highs and higher lows (continuation): Since the Mar-Apr base, price has stepped up with each pullback holding above the rising 50-day averages. This resembles an ascending-triangle or bull-flag continuation structure, and the Jun and Aug pullbacks were bought at the 50-day average.
- Base breakout (reversal): The Jan-Mar lows (~$245-250) with a higher-low retest resemble a bullish double bottom / inverted head and shoulders. The measured move from the base (neckline in the ~$300s) has largely been achieved, so further upside is a trend-continuation move.
- Risk pattern: The recent advance with weaker momentum could morph into a bearish rising wedge or expanding triangle if price stalls near $365-370 and breaks below $338-340. That would target the $320 area.
- Targets: The continuation breakout above $368 projects roughly $385-400. The flag-style pullback target is a hold at $338-346 before resuming.
POTENTIAL SCENARIOS
- Scenario 1: Bullish Trend Continuation — Price digests near the upper band, holds the rising 50-day averages, and extends the uptrend with higher highs. Trigger: a daily close above $368 with MACD staying above its signal and ADX rising above 20-25. Target: $380-$400. Invalidation: a daily close below $338 (EMA50/SMA50D). (52% probability)
- Scenario 2: Neutral Consolidation / Pullback and Range — Overbought, flat-CMF conditions lead to a mean reversion to the band midline and 50-day averages, followed by a choppy range. Trigger: rejection at $365-370 with volume drying up. Target: range-trading between $338 and $368. Invalidation: a break above $370 (bullish) or below $334 (bearish). (28% probability)
- Scenario 3: Bearish Reversal — Weak momentum and CMF fail to support new highs, a rising-wedge breakdown occurs, and the 50-day averages are lost. Trigger: a daily close below $334.5 (lower band) and $338 with MACD crossing below its signal. Target: $315-$320 (toward the prior consolidation, still above the SMA200D). Invalidation: a reclaim of $350. (20% probability)
PRICE TARGETS
For the 83-day horizon (about Feb 6, 2027), the range width should be about 18-30% of price. The Expected Range of $335.00 to $410.00 is $75 wide, or about 21% of $356.27, which is consistent with the guidance and roughly 1 standard deviation of ATR-based movement over the period.
- Target Price: $380.00 (about +6.7% from the current price)
- Expected Range: $335.00 to $410.00
- Key Levels: Support at $338.75 (EMA50/SMA50D zone), Resistance at $368.00 (recent swing high)
OVERALL BIAS
OVERALL BIAS: BULLISH - Price is above every major moving average with a golden cross intact, MACD has re-crossed bullish, and +DI dominates −DI. Neutral CMF, weak ADX, and a stretched upper-band position suggest the advance will be gradual, with pullbacks to $338-346 likely along the way.
This is educational analysis and not financial advice.