AAPL 27-day bullish forecast — Nov 15, 2026
- Bias: Bullish
- Timeframe: 27 days (made Nov 15, 2026, target date Dec 11, 2026)
- Price at analysis: $356.27
- Price target: $365.00
- Expected range: $336.00 – $381.00
- Result: Pending — graded after the close on Dec 11, 2026
Get a free AI analysis of AAPL today
Analysis
TECHNICAL INDICATORS
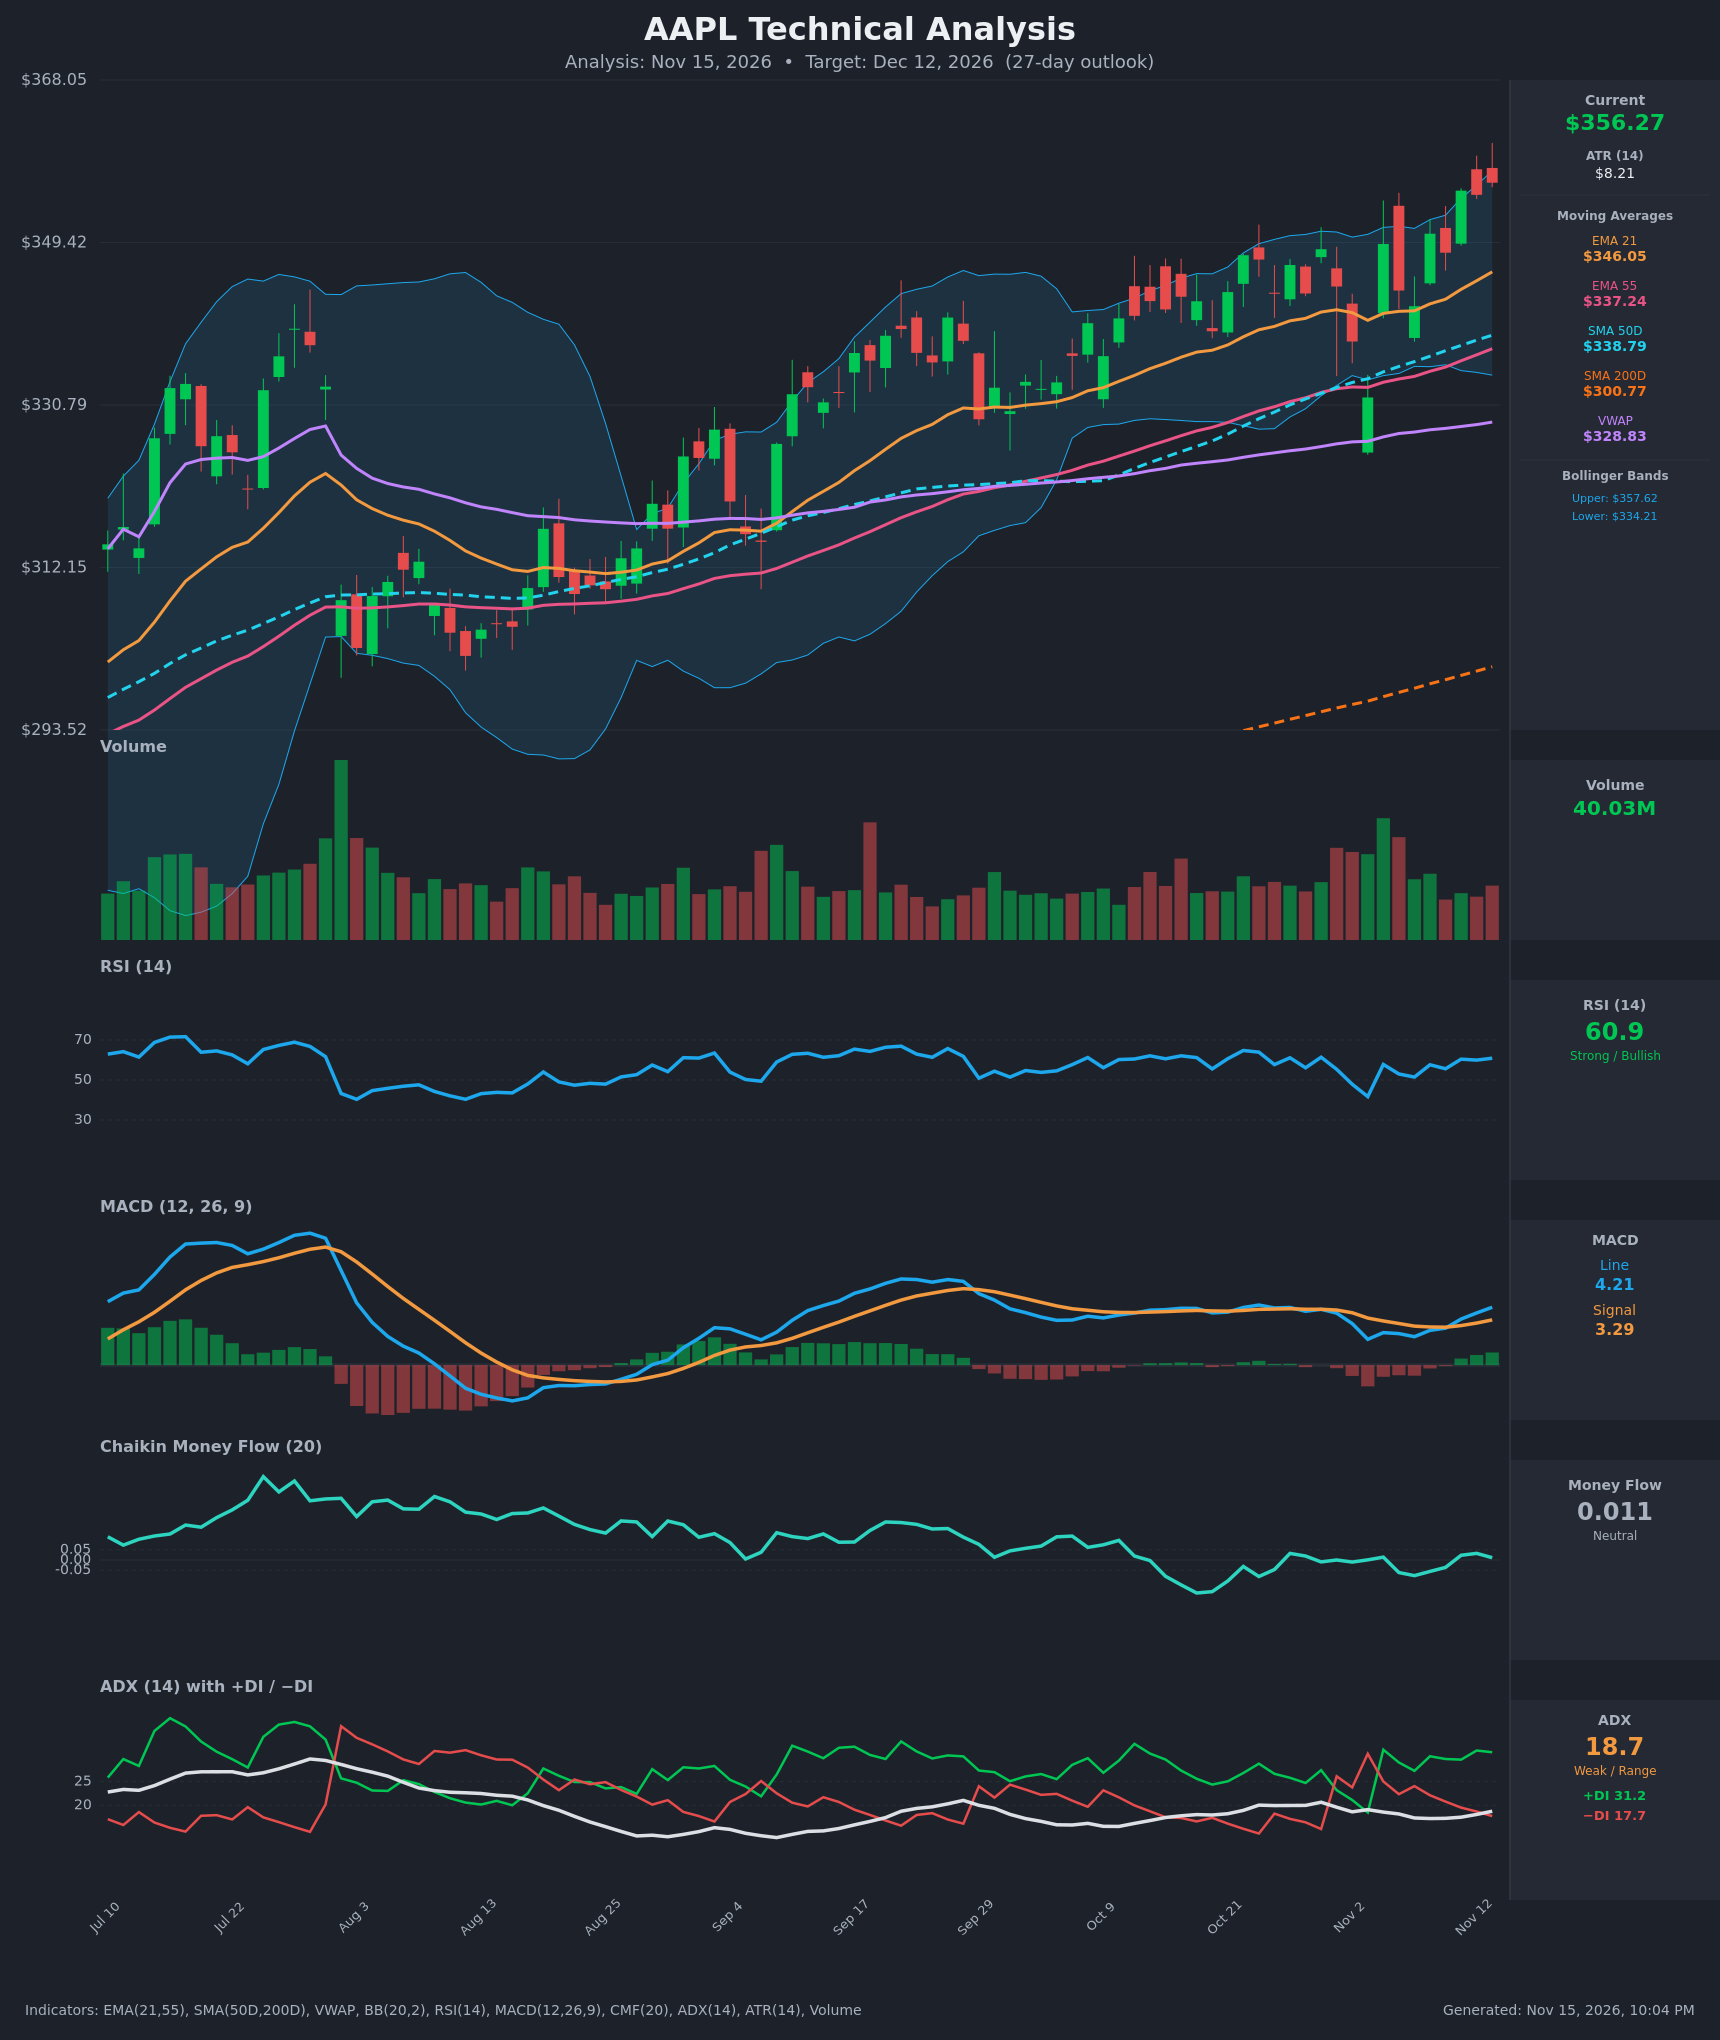
- RSI (14): 60.9, in bullish territory but below 70. It has recovered from 41.7 on Nov 3 and is holding in the 55-61 range over the last several bars. It is slightly lower than the mid-October peaks (~64-66) even though price is higher, so there is room to run but little momentum acceleration. [Bullish]
- 20 EMA (EMA 21): $346.05. Price at $356.27 is about 3% above it, and the EMA is rising and has held as support on pullbacks. EMA21 is also above EMA55 ($337.24), and the gap is widening. [Bullish]
- MACD: Line 4.21 is above signal 3.29, and the histogram is positive (+0.92) and expanding. A bullish crossover occurred on Nov 11 (the line moved from 2.69, below the signal at 2.76, to 3.35, above 2.88). Both lines are above zero. [Bullish]
- Bollinger Bands (20): Upper $357.62, lower $334.21, and price at $356.27 is right at the upper band. The bands are fairly narrow and rising, which is a moderate "walking the band" setup. Short-term upside is limited until the band is cleared, and a cooldown toward the midline (~$346) is plausible. [Neutral]
- CMF (20): 0.011, between -0.05 and +0.05, so there is no clear accumulation. It has hovered near zero and been slightly negative at times (-0.077 on Nov 6), so buying pressure is not confirming the breakout to new highs. [Neutral]
- ADX (14): 18.7 (below 20, weak trend), with +DI 31.2 well above −DI 17.7. Bulls clearly control direction, but trend strength is not yet established. ADX is rising slightly from 17.2, which hints at a developing trend. [Weak Trend + Bullish direction]
- Volume: 40.03M, moderate and near average. It is well below the spike days (Oct 30-Nov 3) that came with the sell-off and rebound. The breakout above $350 has come on unremarkable volume, so there is no strong institutional confirmation yet. [Neutral to mildly Bullish]
Other trend context:
- SMA 50D/200D: SMA50D ($338.79) is well above SMA200D ($300.77), so the golden cross is long established.
- VWAP: Price is above VWAP ($328.83) and all major moving averages.
DIVERGENCES & TRENDS
- Mild momentum divergence: Price is at its highest level on the chart, but RSI (60.9) is below its September-October peaks (~64-66). This is a weak warning that momentum is not accelerating, not a confirmed bearish divergence.
- CMF/volume non-confirmation: Price is making new highs while CMF stays near zero, so accumulation is not supporting the move.
- MACD: A fresh bullish crossover with a rising histogram supports continuation. The earlier flat MACD in late October (histogram near zero) resolved upward.
- Moving averages: The stack is fully bullish (price > EMA21 > SMA50D/EMA55 > VWAP > SMA200D), with no crossovers pending.
- DI: +DI has stayed above −DI for most of the recent period apart from the Oct 30-Nov 3 dip. ADX under 20 means any trend is still immature.
- Volatility: The price/ATR relationship ($8.21, ~2.3%) shows high daily noise, which argues for a wide forecast range.
CHART PATTERNS
- Rising channel / Ascending Triangle-style breakout (continuation): Price built a base between roughly $331 and $350 from late October to early November and then broke above $350 on Nov 11. This is similar to the Ascending Triangle or Bullish Flag in the reference diagram. The measured move (base height of ~$19 added to the $350 breakout) points to ~$369.
- Higher highs and higher lows: The sequence since the August low (~$305) forms a steady uptrend channel.
- Caution: Price is testing the upper Bollinger Band. A failed breakout would turn the structure into a range (similar to a Double Top near $356-$358), with the lower end near $340-$346.
POTENTIAL SCENARIOS
- Scenario 1: Bullish Breakout Continuation — Price clears the upper Bollinger Band and the recent high area, with the MACD expansion and +DI dominance pulling ADX above 20-25. Trigger: daily close above $358-$360 on rising volume. Target: $366-$370 (measured move). Invalidation: daily close below $346 (EMA21). (50% probability)
- Scenario 2: Neutral Consolidation Near Highs — Price stalls at the upper band, and weak ADX and flat CMF keep it between EMA21 and the band top. Trigger: failed breakout attempts above $358 and RSI flattening near 55-60. Target: $344-$358 trading range. Invalidation: a close above $360 or below $340. (30% probability)
- Scenario 3: Bearish Pullback — Overextension at the upper band and the lack of volume/CMF confirmation trigger a mean-reversion pullback. Trigger: a close below $346 with the MACD histogram turning negative. Target: $337-$339 (SMA50D/EMA55 cluster), possibly the $329 VWAP. Invalidation: a reclaim of $356 on a closing basis. (20% probability)
PRICE TARGETS
- Target Price: $365.00 (27-day horizon, Dec 12, 2026)
- Expected Range: $336.00 to $381.00. Width is $45, or about 12.6% of the current price, consistent with the 14-30 day guidance and the ~2.3% daily ATR.
- Key Levels: Support at $346.05 (EMA21), Resistance at $357.62 (upper Bollinger Band); beyond that, the next resistance is near $368-$370.
OVERALL BIAS
OVERALL BIAS: BULLISH - Price is above all key moving averages, MACD has a fresh bullish crossover with an expanding histogram, +DI dominates −DI, and the base breakout above $350 projects toward ~$369. Conviction is moderate because ADX is below 20, CMF is neutral, and price is pressed against the upper Bollinger Band.
This is educational analysis and not financial advice.