AAPL 48-day bullish forecast — Nov 15, 2026
- Bias: Bullish
- Timeframe: 48 days (made Nov 15, 2026, target date Jan 1, 2027)
- Price at analysis: $356.27
- Price target: $366.50
- Expected range: $336.00 – $389.00
- Result: Pending — graded after the close on Jan 1, 2027
Get a free AI analysis of AAPL today
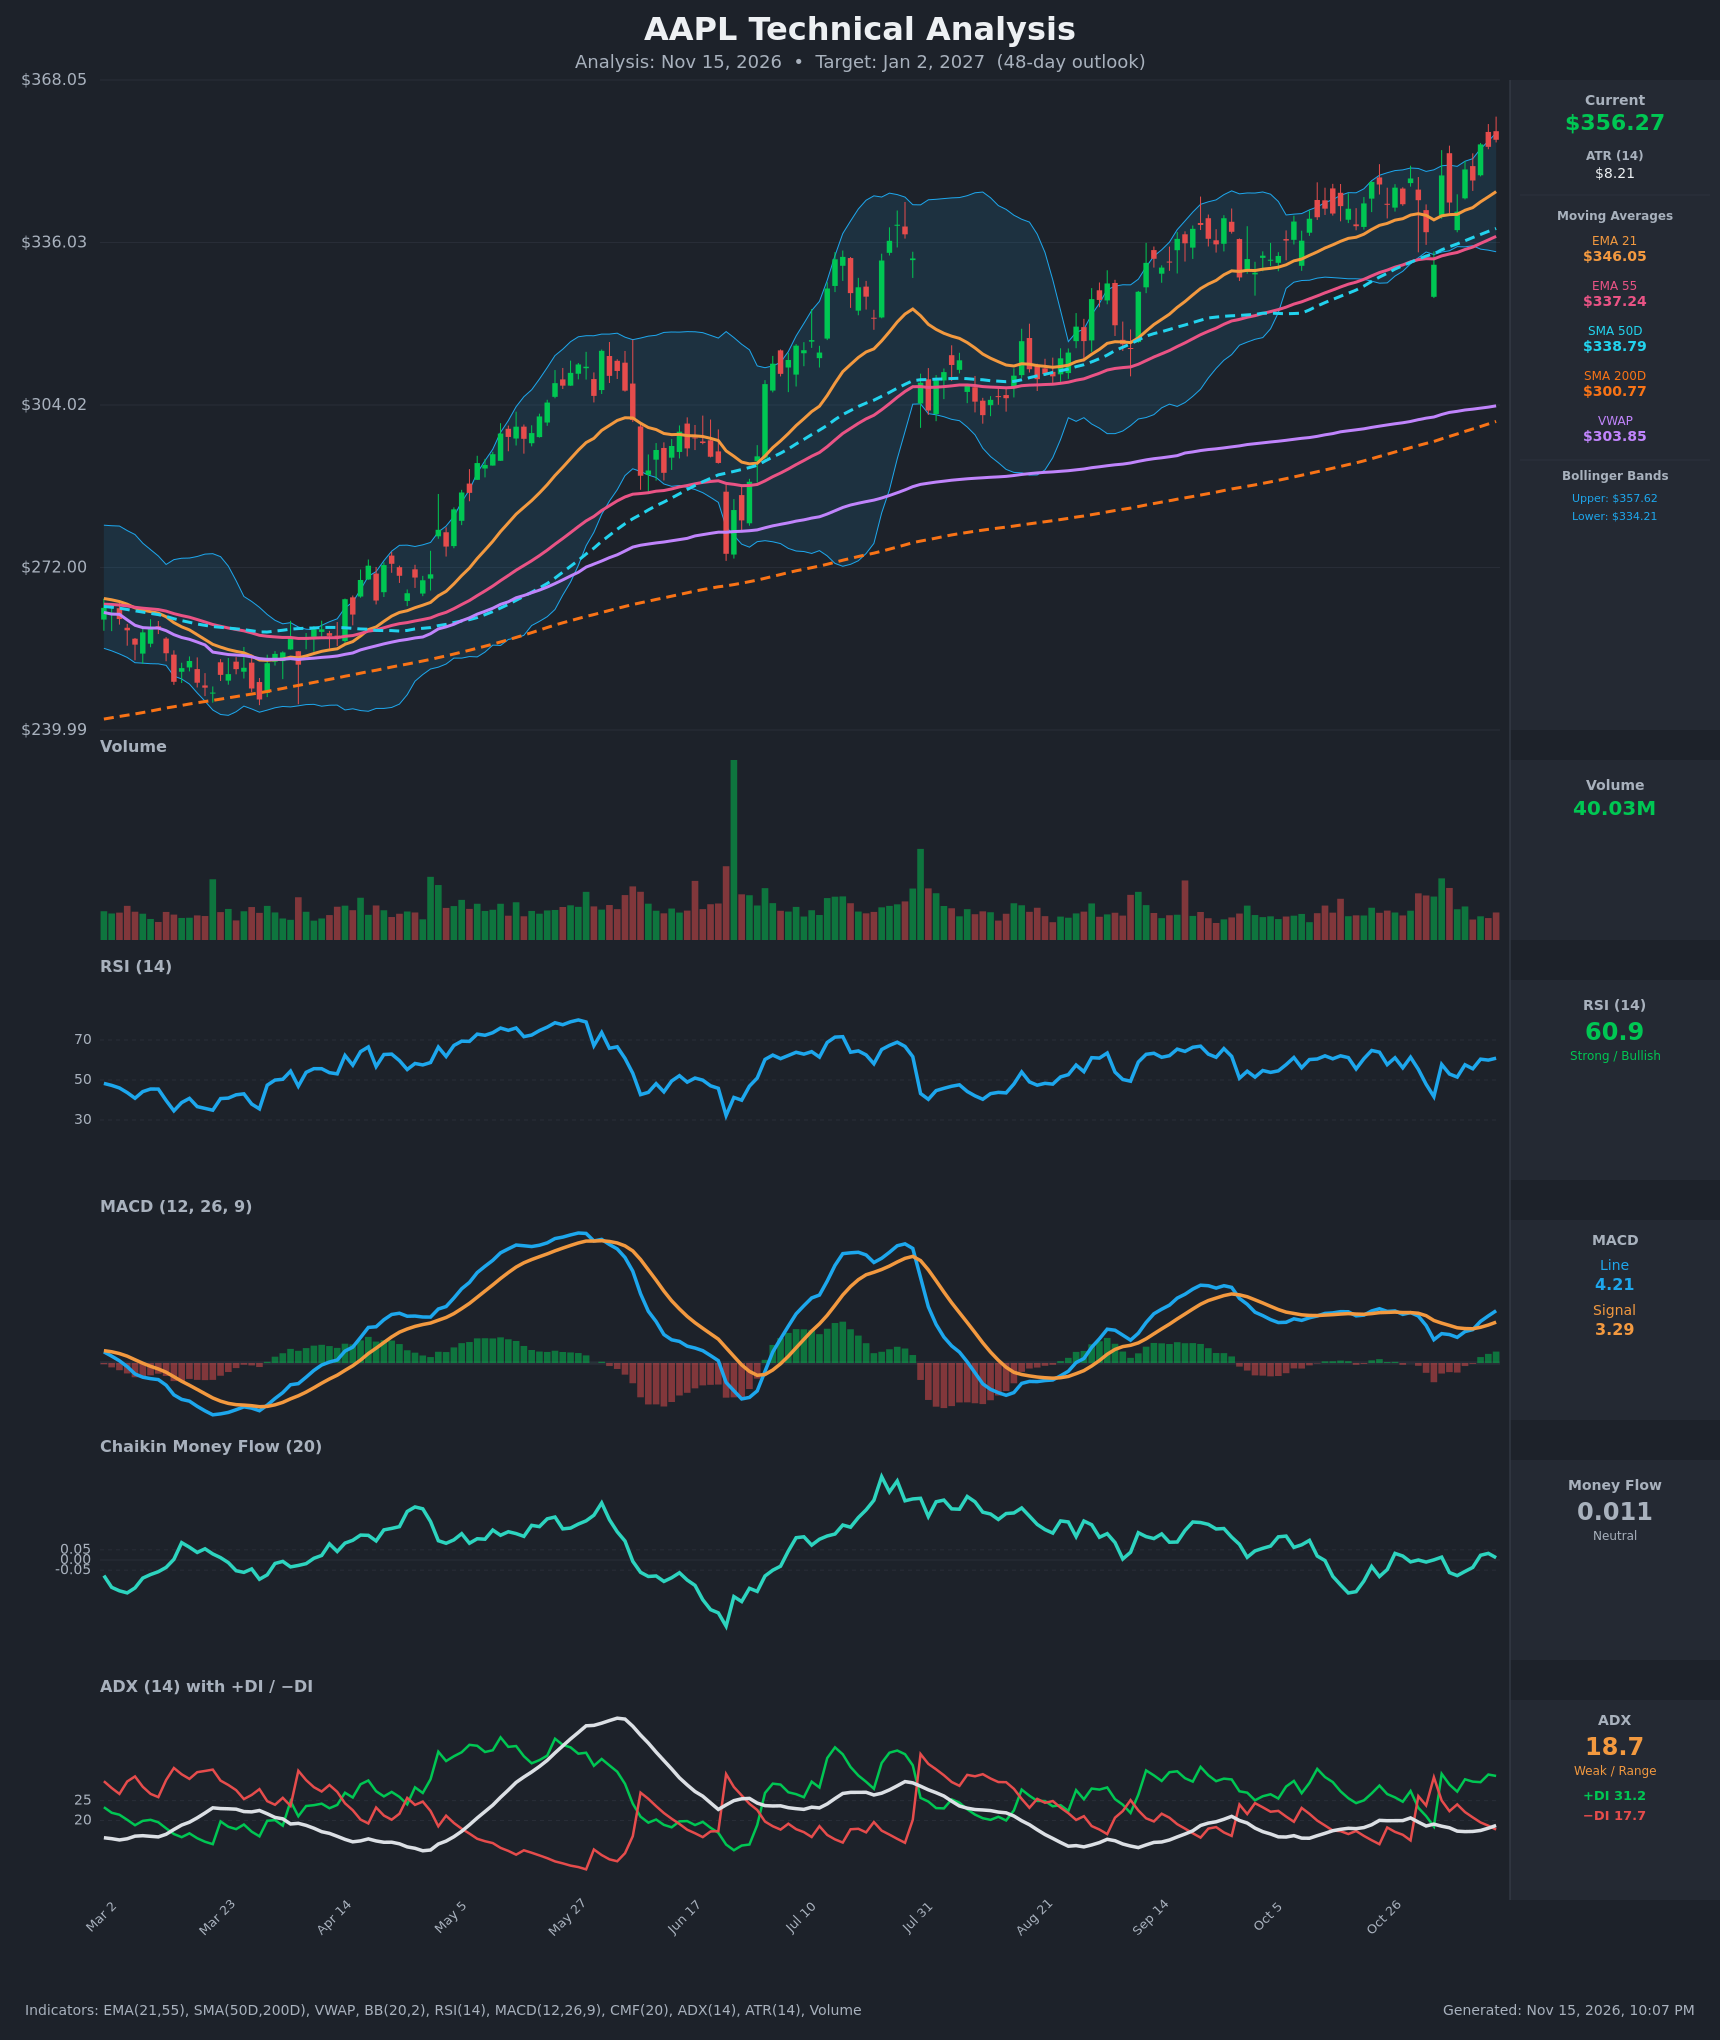
Analysis
TECHNICAL INDICATORS
- RSI (14): 60.9. It is in the bullish zone but not overbought, and has risen from 51.5 on Nov 6. Its peaks have been falling across the year (about 77 in May, 71 in July, 65 in October), so momentum is improving short-term but weaker than prior legs. [Bullish]
- 20 EMA (EMA 21 = $346.05): Price at $356.27 is about 3% above it and the EMA is rising. It has acted as dynamic support throughout the October–November advance and sits above EMA 55 ($337.24). [Bullish]
- MACD: Line 4.21 versus signal 3.29, so the histogram is about +0.92 and expanding. The bullish crossover came on Nov 11 after the line dipped below the signal in early November. The line is still well below its May and July peaks. [Bullish]
- Bollinger Bands (20): Upper $357.62, lower $334.21, so price sits at about 94% of the band range, just under the upper band. Bands are widening, which fits an upside push. Price can "walk the band" in a trend, but the near-term risk of a pause or pullback to the midline (about $346) is elevated. [Bullish, stretched]
- CMF (20): 0.011, inside the ±0.05 neutral zone. It has hovered around zero for weeks, so the rally is not backed by strong accumulation. [Neutral]
- ADX (14): 18.7, below 20 and so a weak trend reading. +DI (31.2) is well above −DI (17.7), meaning direction favors bulls but trend strength is not confirmed. ADX is edging up from 17.2. [Weak Trend, Bullish direction]
- Volume: 40.03M, about average and unremarkable. There is no volume surge on the recent breakout to new highs, so conviction is modest. [Neutral / mildly confirming]
DIVERGENCES & TRENDS
- Moving averages: The structure is fully bullish, with price > EMA21 ($346.05) > SMA50 ($338.79) ≈ EMA55 ($337.24) > SMA200 ($300.77) > VWAP ($303.85). The golden cross occurred long ago, and the SMA200 is still rising.
- Long-term momentum divergence: Price is at new highs near $356–$367 while RSI and MACD peaks have been getting lower since May. This is a mild bearish divergence and caps upside conviction.
- Money flow and trend strength: CMF is flat around zero and ADX is below 20, so the advance is steady but not powerful.
- Recent crossovers: The MACD bullish crossover on Nov 11 and +DI firmly above −DI are supportive. The Nov 3 dip to $331.65 was bought quickly (RSI fell to 41.7 and rebounded within a day), showing dip-buying demand.
- Stretch from the long-term mean: Price is about 18% above SMA200 and 17% above VWAP, so mean-reversion risk is meaningful over weeks.
CHART PATTERNS
- Ascending channel / higher highs and higher lows: Since March, price has made a clean sequence of higher highs and higher lows above a rising SMA200.
- Ascending Triangle-style breakout (continuation): The July–October consolidation held higher lows against a flat ceiling near $340–$350. Price broke out of it in November. The measured move from that base points to roughly $365–$375.
- Not present: There is no confirmed reversal structure (double top, head and shoulders, rising wedge). The slightly steepening slope in the last few weeks is worth watching as a possible rising-wedge risk.
- Pattern significance: Pattern targets sit near $366–$375, and the upper chart range is about $368.
POTENTIAL SCENARIOS
- Scenario 1: Bullish Trend Continuation — Price keeps respecting the EMA21 and the ascending channel, with the Nov 11 MACD crossover and +DI dominance extending the uptrend. Trigger: Daily close above $358–$360 (upper Bollinger Band and recent high) with volume improving. Target: $366–$378. Invalidation: Daily close below $338 (SMA50/EMA55 zone). (50% probability)
- Scenario 2: Neutral Consolidation Near Highs — With ADX under 20 and CMF flat, price digests gains in a $344–$362 range. Trigger: Failure to hold above the upper band and repeated rejection near $360–$368. Target: $346–$358. Invalidation: Close above $368 or below $338. (25% probability)
- Scenario 3: Bearish Mean-Reversion Pullback — Price is stretched from the SMA200 and VWAP, momentum peaks are lower, and volume is unconvincing. Trigger: Close below the EMA21 ($346) and a bearish MACD re-cross. Target: $334–$338 (lower Bollinger Band, SMA50). Invalidation: Reclaim of $358. (25% probability)
PRICE TARGETS
- Target Price: $366.50 (48-day horizon, about +2.9% from $356.27)
- Expected Range: $336.00 to $389.00 (width $53.00, about 14.9% of current price, within the 12–18% guidance for 30–60 days)
- Key Levels: Support at $346.05 (EMA21, with $338.79 SMA50 beneath), Resistance at $368.05 (chart high and top of the visible range)
OVERALL BIAS
OVERALL BIAS: BULLISH - Price is above all key moving averages, the MACD has crossed up, and +DI dominates −DI within a clean higher-high, higher-low structure. Weak ADX, neutral CMF, lower momentum peaks and the stretch above the 200-day make the expected gain modest and pullbacks likely along the way.
This is educational analysis and not financial advice.