AAPL 34-day bullish forecast — Nov 15, 2026
- Bias: Bullish
- Timeframe: 34 days (made Nov 15, 2026, target date Dec 18, 2026)
- Price at analysis: $356.27
- Price target: $364.00
- Expected range: $338.00 – $384.00
- Result: Pending — graded after the close on Dec 18, 2026
Get a free AI analysis of AAPL today
Analysis
TECHNICAL INDICATORS
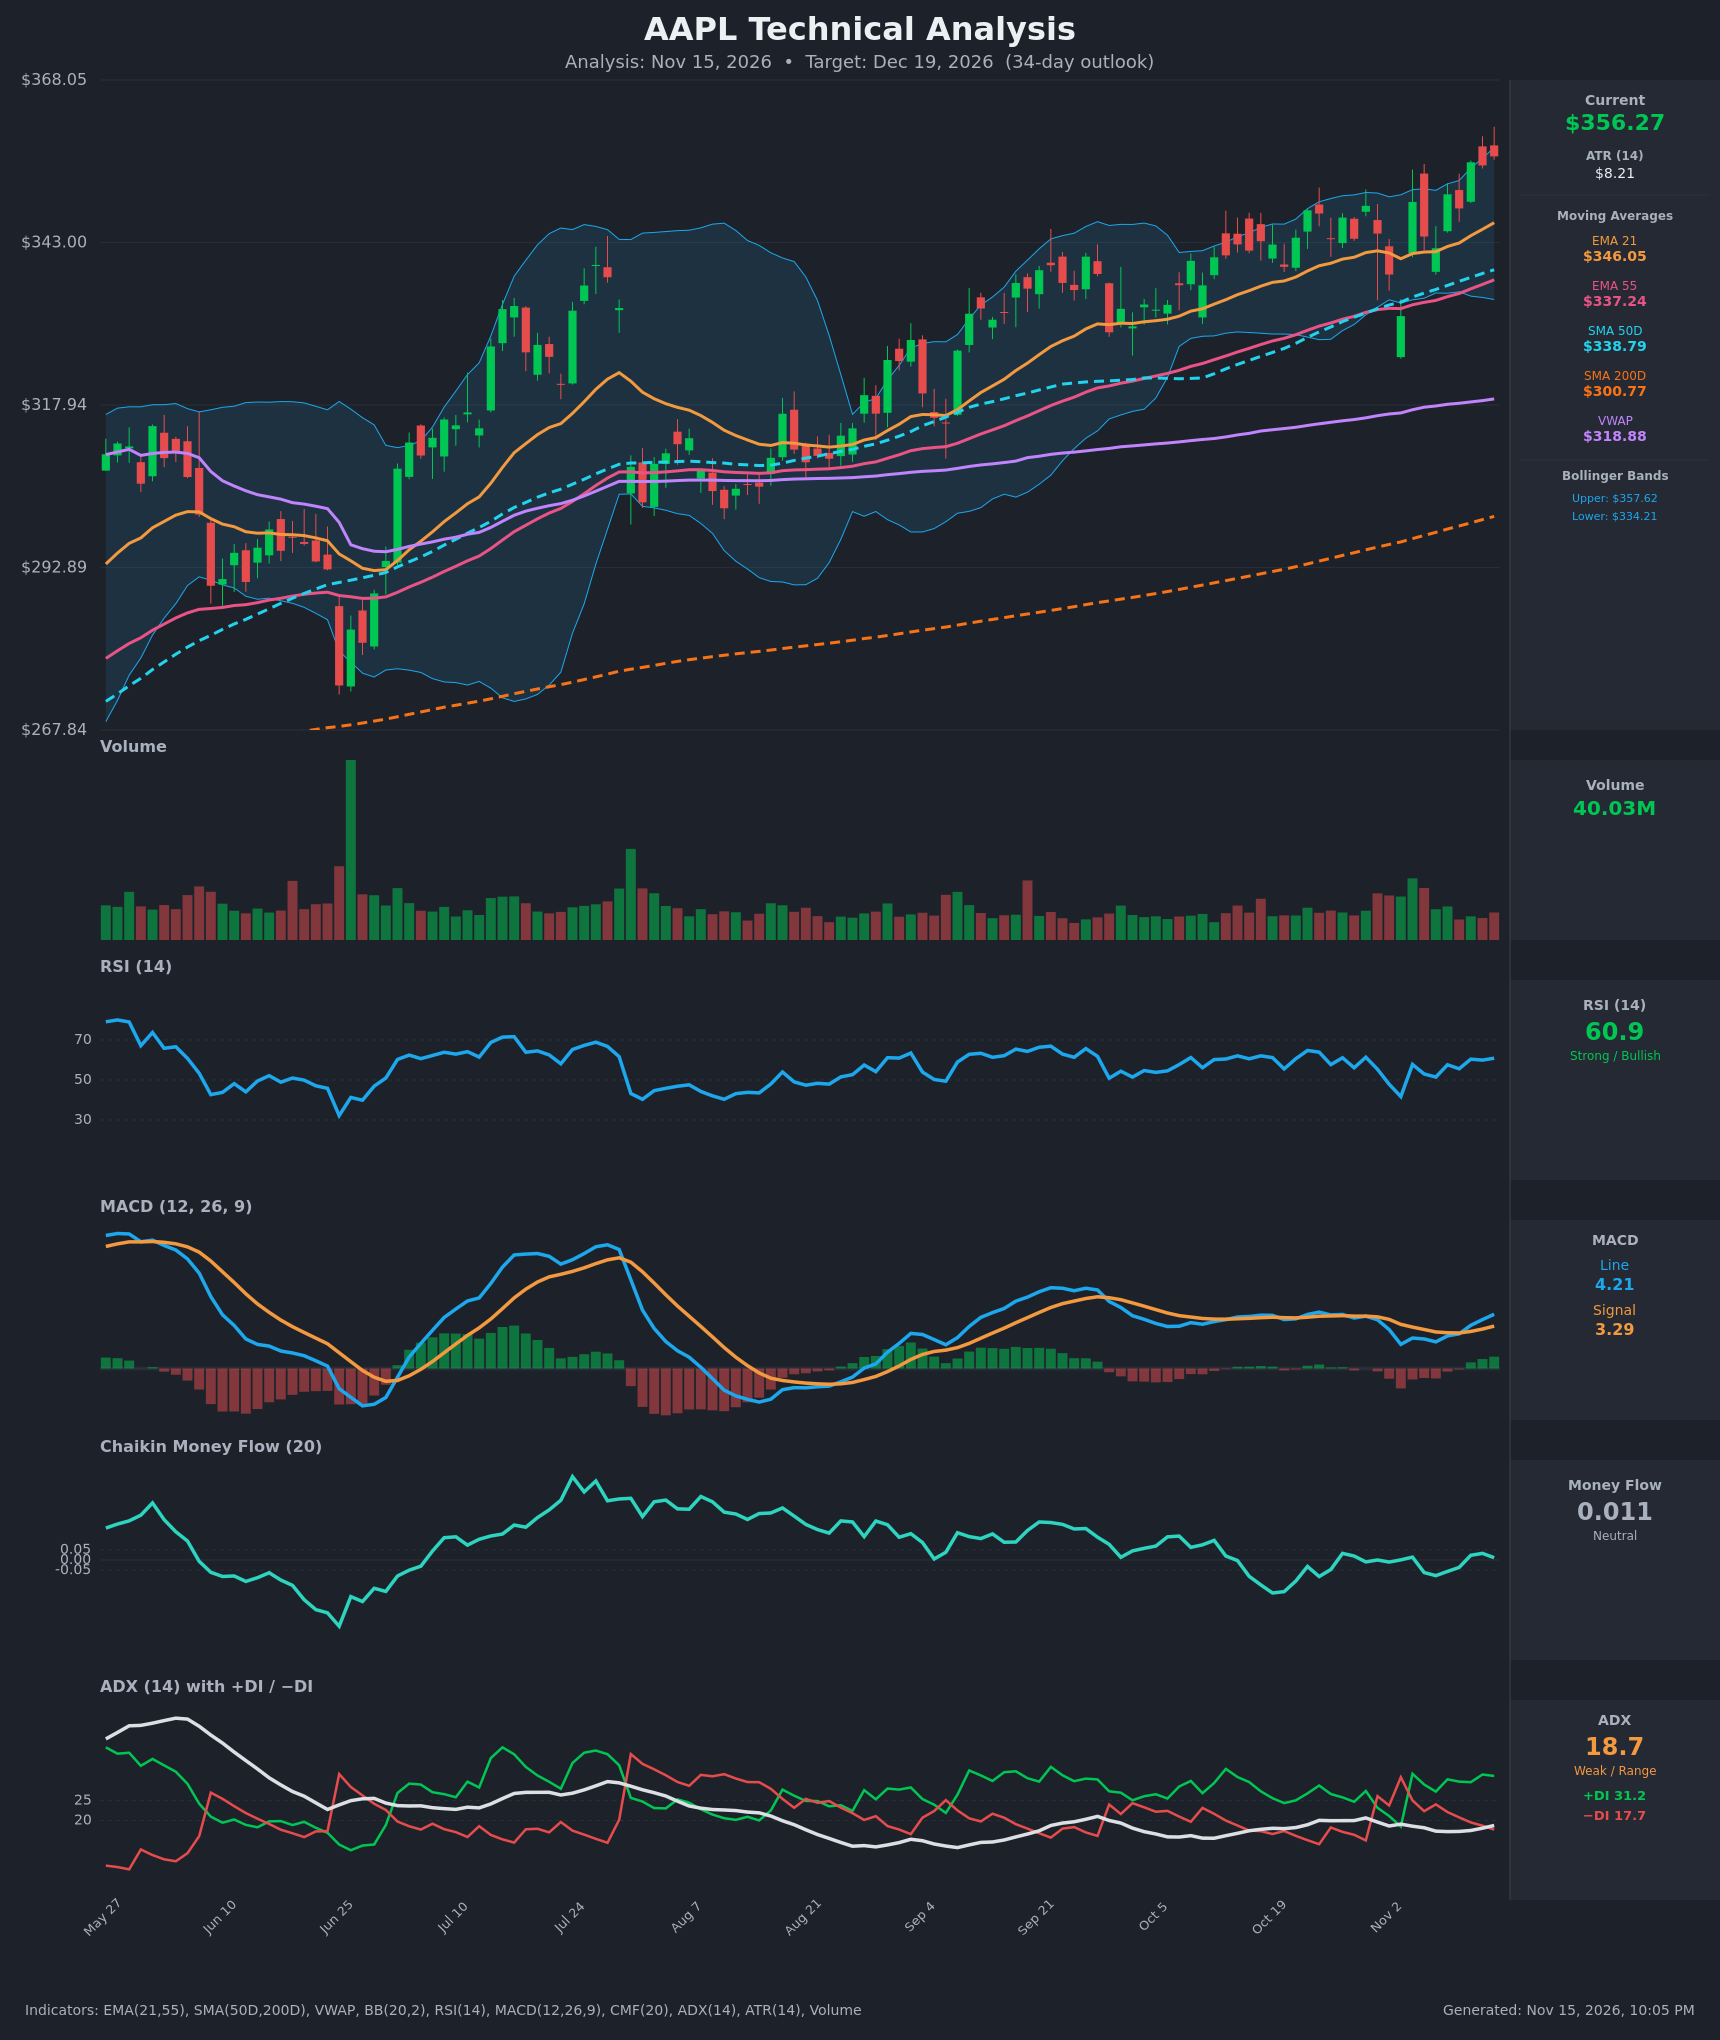
- RSI (14): 60.90, in the bullish half of the range but below overbought (70). It has held between roughly 50 and 62 for the last several sessions after a dip to 41.7 on Nov 3. Momentum is recovering, not stretched. [Bullish]
- 20 EMA (EMA 21): $346.05, with price at $356.27 about 3% above it. The EMA is sloping up and has held as dynamic support on every pullback since September. EMA21 is also above EMA55 ($337.24), which confirms the uptrend. [Bullish]
- MACD: Line 4.21 is above Signal 3.29, a bullish crossover that occurred on Nov 11. The histogram has flipped positive and is expanding (about +0.92). The line is still well below its earlier peaks, so momentum is improving but not yet strong. [Bullish]
- Bollinger Bands (20): Upper $357.62, lower $334.21, with price at $356.27 just under the upper band, so it is "walking the band" near the top. That signals strength in a trend, but it also raises the odds of a pause or mean-reversion toward the midline (about $346). [Bullish]
- CMF (20): 0.011, inside the neutral zone (±0.05) and oscillating around zero for weeks. Buying pressure is not confirming the price advance, a mild caution. [Neutral]
- ADX (14): 18.7, below 20, so trend strength is weak. +DI (31.2) is well above −DI (17.7), so bulls control direction. ADX is edging up from 17.2, which is early evidence of trend strength building. [Weak Trend, Bullish direction]
- Volume: 40.03M, around average with no volume spike on the recent breakout. The Nov 11–13 advance came on ordinary participation, so the move is orderly but not high-conviction. [Neutral to mildly supportive]
DIVERGENCES & TRENDS
- MA structure: Price ($356.27) > EMA21 ($346.05) > SMA50D ($338.79) ≈ EMA55 ($337.24) > VWAP ($318.88) > SMA200D ($300.77). This is a fully bullish stack. The golden cross (SMA50D above SMA200D) is long established, and the gap is still widening.
- VWAP/SMA200 extension: Price is about 12% above VWAP and about 18% above SMA200D. That is extended on a longer horizon and leaves room for a pullback toward the faster MAs.
- MACD: A bullish signal-line crossover occurred on Nov 11, and the histogram is growing.
- RSI vs. price: Price is making new highs while RSI is flat around 60–61, matching its late-October readings. There is no clear bearish divergence, but RSI is not confirming with higher highs either.
- CMF vs. price: CMF is hovering near zero while price rises, a mild non-confirmation that suggests the rally is not backed by strong accumulation.
- ADX/DI: −DI briefly crossed above +DI around Oct 30–Nov 3, during a pullback to $331.65. Bulls retook control on Nov 4, and the +DI/−DI spread is now wide.
- Trend: A series of higher lows and higher highs has held since the late-June bottom, with a breakout above the $349–350 area in the last few sessions.
CHART PATTERNS
- Primary structure: A rising trend channel with higher highs and higher lows. The October consolidation, with a flat-ish ceiling around $349–350 and rising lows, resembles an Ascending Triangle (continuation) that resolved upward on Nov 11 above about $350.
- Target: The measured move of the Oct–Nov range (about $18–20 from the $331 low to the $350 ceiling) projects toward roughly $368–$370 from the breakout level.
- Caution: There are no signs of a Rising Wedge or Double Top yet. The upper-band proximity and flat CMF are the main reasons to watch for a failed breakout, which would turn this into a bull trap.
POTENTIAL SCENARIOS
- Scenario 1: Bullish Breakout Continuation — The ascending-triangle breakout holds, with price consolidating above the $350 breakout zone and the EMA21 rising beneath it. MACD and +DI stay supportive, and ADX rises above 20 as the trend firms. Trigger: a daily close above $358–$360 on stronger volume. Target: $368–$380. Invalidation: a daily close below $346 (EMA21) and a MACD re-cross lower. (50% probability)
- Scenario 2: Neutral Consolidation Near the Highs — Price stalls near the upper Bollinger Band, with weak ADX and neutral CMF keeping it in a $346–$362 range as the bands re-center. Trigger: repeated rejections at $360–$366 with shrinking volume. Target: $346–$358. Invalidation: a break above $366 or below $338. (20% probability)
- Scenario 3: Bearish Pullback / Failed Breakout — The move proves a bull trap, with price extended from VWAP and SMA200 and flat CMF showing no accumulation. Price loses the EMA21 and retests the SMA50/EMA55 cluster. Trigger: a daily close below $346 with MACD turning down. Target: $334–$338, and possibly the lower Bollinger Band. Invalidation: a reclaim of $356 on a closing basis. (30% probability)
PRICE TARGETS
- Target Price: $364.00 (34-day horizon, Dec 19, 2026)
- Expected Range: $338.00 to $384.00 (width $46.00, about 12.9% of the current price, consistent with the 30–60 day guidance)
- Key Levels: Support at $346.05 (EMA21), with deeper support at $338.79 (SMA50D) and $337.24 (EMA55). Resistance at $366.00 (recent high and the top of the chart), then $380.00.
OVERALL BIAS
OVERALL BIAS: BULLISH - Price is above every moving average in a fully bullish stack, the MACD has crossed up with an expanding histogram, and +DI is well above −DI after a breakout above the $350 area. Conviction is modest because ADX is weak (18.7), CMF is neutral and price is pressed against the upper Bollinger Band, so expect choppy upside rather than a sharp rally.
This is educational analysis and not financial advice.