AAPL 62-day bullish forecast — Nov 15, 2026
- Bias: Bullish
- Timeframe: 62 days (made Nov 15, 2026, target date Jan 15, 2027)
- Price at analysis: $356.27
- Price target: $372.00
- Expected range: $322.00 – $394.00
- Result: Pending — graded after the close on Jan 15, 2027
Get a free AI analysis of AAPL today
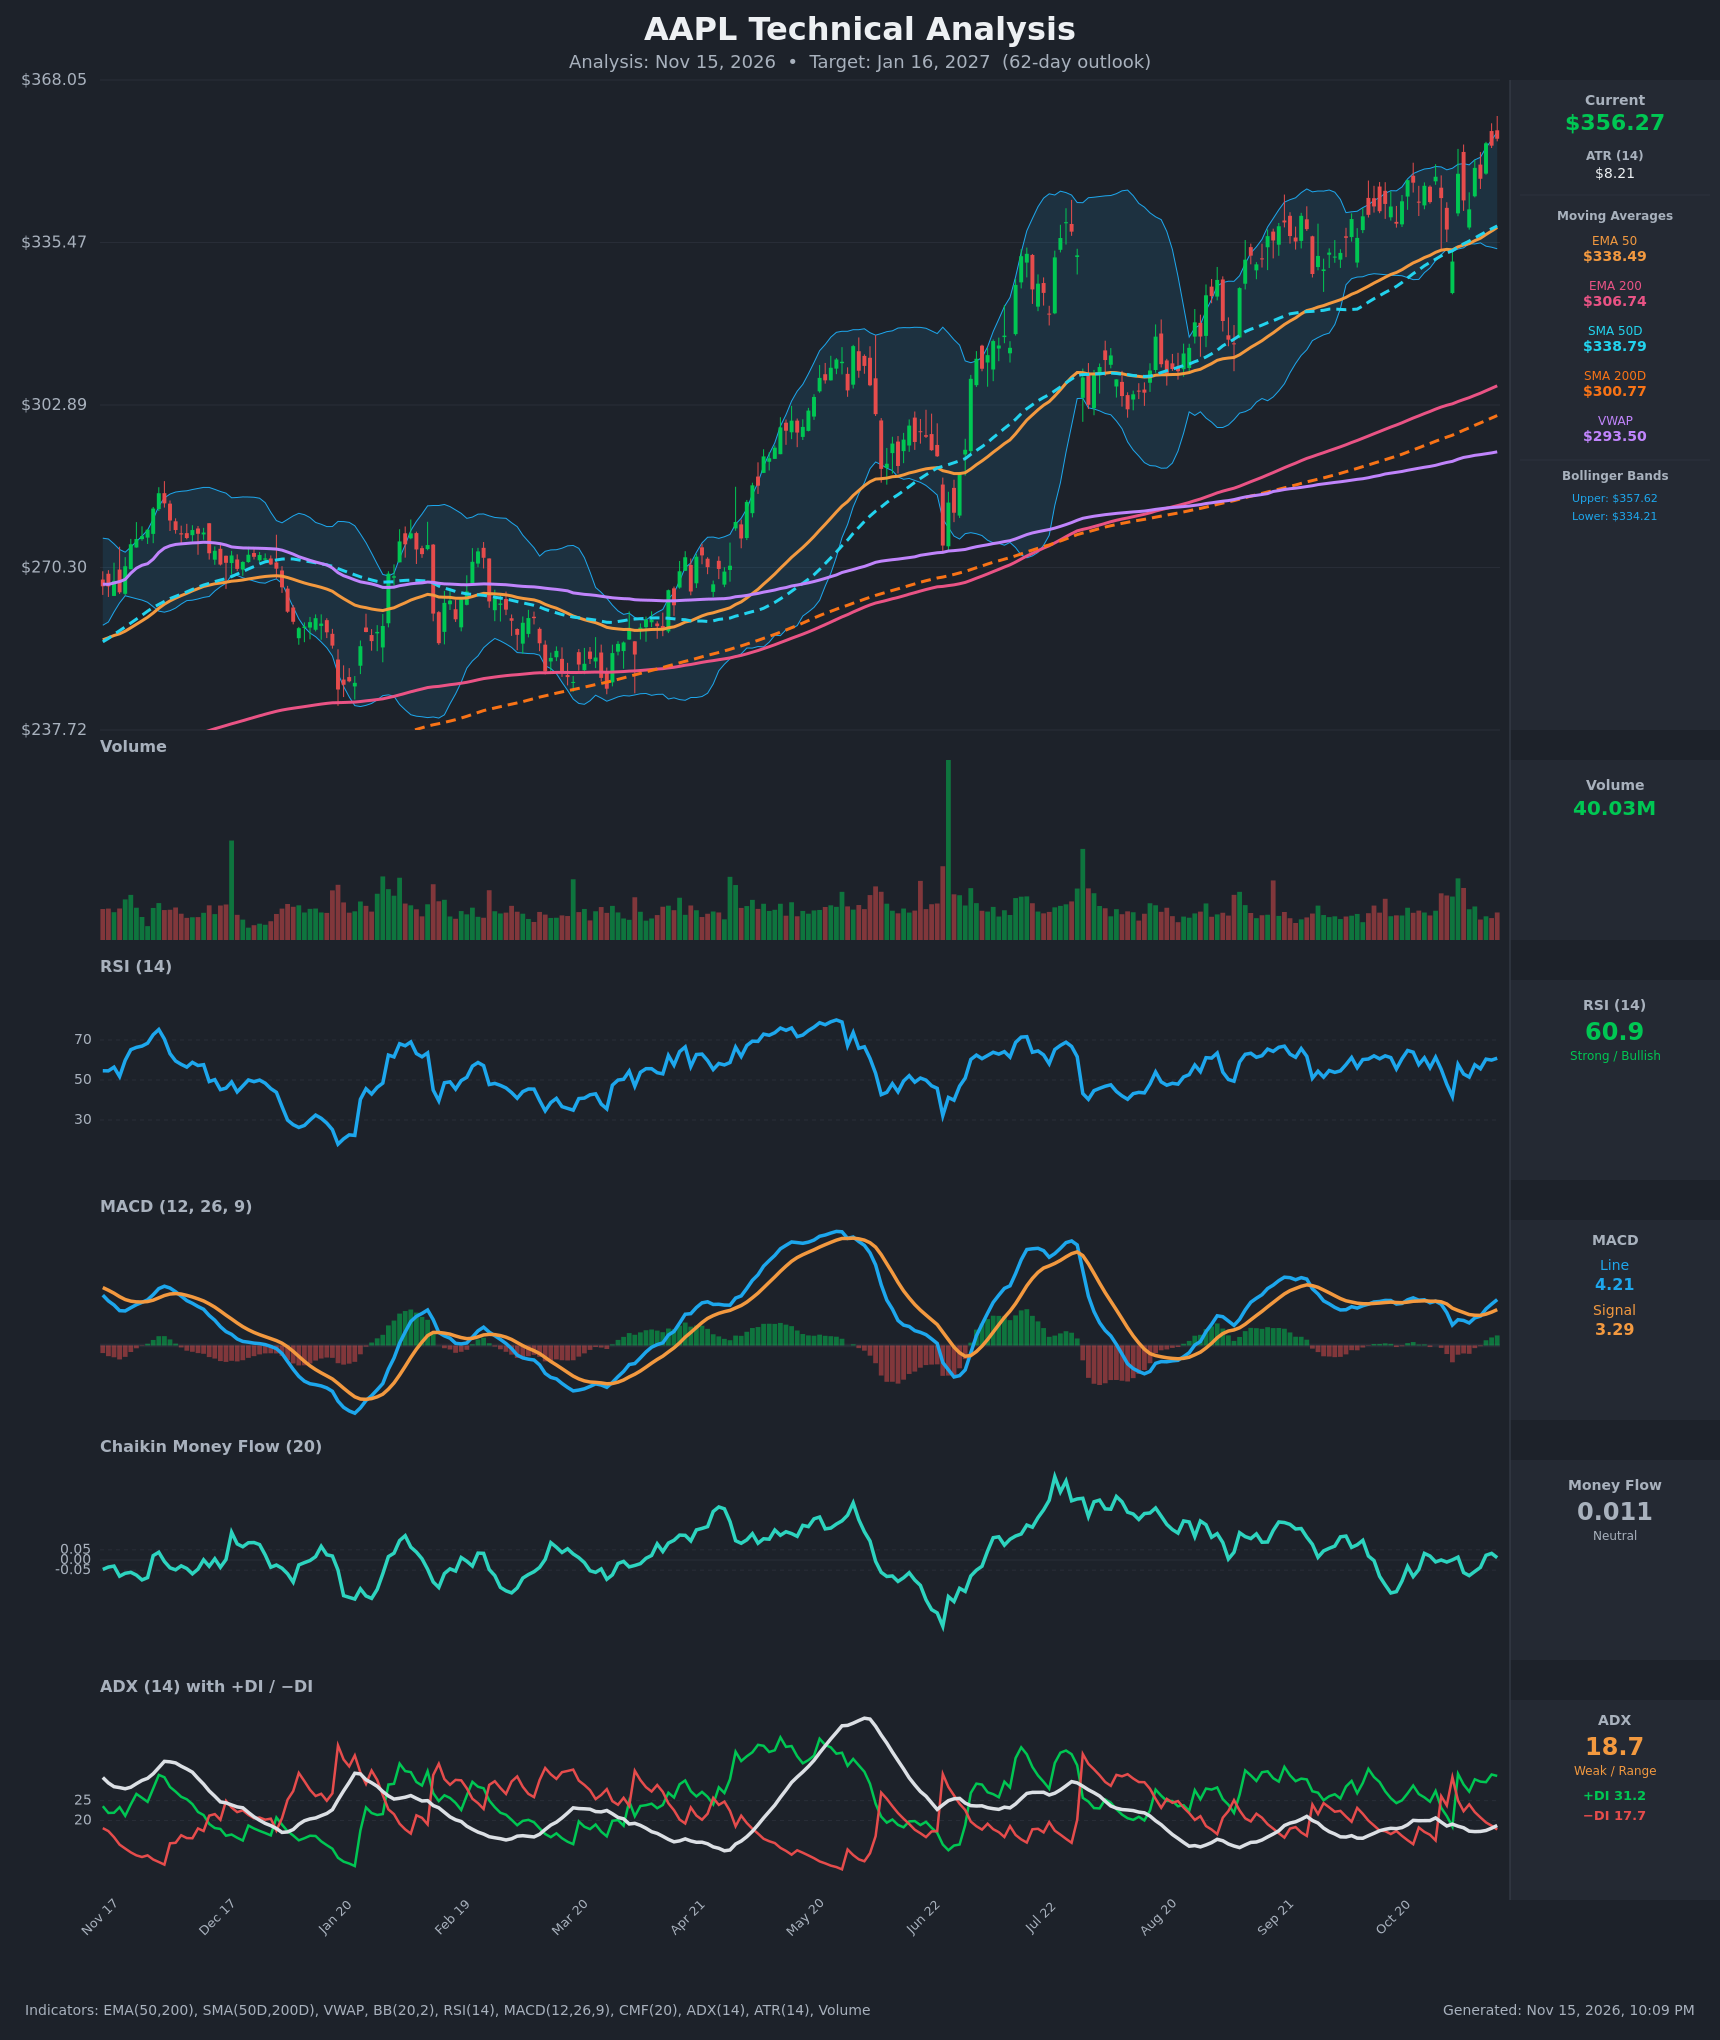
Analysis
TECHNICAL INDICATORS
- RSI (14): 60.9, in the bullish zone but well short of overbought (70). It has bounced between about 41 and 61 over the last 15 bars and is now rising again (from 51.5 on Nov 6). On the chart it sits below the 70+ readings from earlier rallies, so momentum is healthy but not stretched. [Bullish]
- 20 EMA: Not supplied. The Bollinger midline (20-period basis) is about $346, and price at $356.27 is roughly $10 above it. The 20-period average is acting as dynamic support, and pullbacks to it (such as the Nov 3 dip to $331.65) were bought quickly. [Bullish]
- MACD: Line 4.21 is above signal 3.29, so the histogram is positive (+0.92) and widening. A bullish re-cross happened around Nov 11, after the line dipped toward 1.9 on Nov 3. The absolute level is far below the May and July peaks, so the move is still modest. [Bullish]
- Bollinger Bands (20): Upper $357.62, lower $334.21. Price is hugging the upper band, which in a trend means strength rather than automatic exhaustion. Bandwidth is moderate (about 6.8%) and the bands are tilting upward. A short-term stall or mean-reversion toward $346 is possible. [Bullish]
- CMF (20): 0.011, inside the ±0.05 neutral band. It has oscillated around zero for weeks and shows no accumulation despite new price highs. This is a mild weakness in the uptrend. [Neutral]
- ADX (14): 18.7, below 20, so trend strength is weak. +DI 31.2 is well above −DI 17.7, so bulls control direction. The spread is wide, but ADX has not confirmed it yet, so there is a risk of choppy, grinding progress rather than a surge. [Weak Trend + Bullish direction]
- Volume: 40.03M on the latest bar, a green bar and above the typical recent bars on the chart, though far below the spike seen around Jun 22. Volume is supportive of the push to new highs but not climactic. [Mildly Bullish]
DIVERGENCES & TRENDS
- Moving-average structure: Price ($356.27) is above EMA50 ($338.49), SMA50D ($338.79), EMA200 ($306.74), SMA200D ($300.77) and VWAP ($293.50). EMA50 is above EMA200 and SMA50D is above SMA200D. These are bullish golden-cross alignments with no recent crossover, and all of the averages are rising.
- Mild non-confirmation: Price is making new highs, but RSI (about 61) is below its earlier peaks of 70+ and MACD (4.2) is far below its May and July peaks. CMF is flat near zero. This is a weak bearish divergence in momentum and money flow, which argues for a slower advance.
- Recent crossovers: The MACD re-crossed bullishly in the last few sessions. The DI spread was briefly inverted on Oct 30 and Nov 3 (−DI above +DI) and has since flipped back firmly to bulls.
- Trend in ADX: ADX has been below 20 for most of the last two weeks, a range-like character inside a gradual uptrend.
CHART PATTERNS
- Rising trend with an ascending-triangle-style consolidation: Highs near $348–356 acted as a roughly flat ceiling during late Oct and Nov, while lows rose (Nov 3 dip to $331.65 was reclaimed quickly). Price is now pressing and pushing through that ceiling, resembling the reference "Ascending Triangle," a bullish continuation pattern. The consolidation height is about $22–25, so a measured move points to about $378–382.
- Larger context: Since the March low (~$245), the stock has formed a staircase of higher highs and higher lows, with a bullish flag-like pause in Aug–Sep before the breakout. No reversal pattern (double top, head and shoulders) is visible. The only caution is overextension above the 50-day average (about 5%).
POTENTIAL SCENARIOS
- Scenario 1: Bullish Breakout Continuation — Price clears the $357–368 zone, with the ascending-triangle-style measured move and the rising MAs providing support. Trigger: daily close above about $358 on volume above 40M, with MACD histogram widening. Target: $375–$385. Invalidation: close below $338.50 (EMA50/SMA50D). (55% probability)
- Scenario 2: Neutral Range Digestion — Weak ADX and flat CMF lead to a sideways grind between the 50-day average and the upper band. Trigger: failed breakouts above $360 and repeated bounces from $340. Target: $340–$360 chop. Invalidation: close above $368 or below $334. (25% probability)
- Scenario 3: Bearish Pullback / Failed Breakout — Momentum non-confirmation and neutral CMF lead to a reversal from the upper band, with a retest of the 50-day average and lower band. Trigger: close below $346 followed by a MACD signal cross down. Target: $322–$334. Invalidation: reclaim of $358 with strong volume. (20% probability)
PRICE TARGETS
Horizon: 62 days (about Jan 16, 2027). The range is $72.00 wide ($394.00 − $322.00), which is about 20.2% of the current price and fits the 18–30% guidance for 61–180 days.
- Target Price: $372.00 (for the 62-day horizon)
- Expected Range: $322.00 to $394.00
- Key Levels: Support at $338.50 (EMA50/SMA50D confluence), Resistance at $367.00 (prior high area / top of chart)
OVERALL BIAS
OVERALL BIAS: BULLISH - Price is above all key moving averages with golden-cross alignment, +DI dominates −DI, MACD is above its signal and rising, and RSI has room before overbought. Conviction is modest because ADX is weak (18.7) and CMF is neutral, so the advance may be gradual.
This is educational analysis and not financial advice.