AAPL 20-day bullish forecast — Nov 15, 2026
- Bias: Bullish
- Timeframe: 20 days (made Nov 15, 2026, target date Dec 4, 2026)
- Price at analysis: $356.27
- Price target: $364.00
- Expected range: $343.00 – $378.00
- Result: Pending — graded after the close on Dec 4, 2026
Get a free AI analysis of AAPL today
Analysis
TECHNICAL INDICATORS
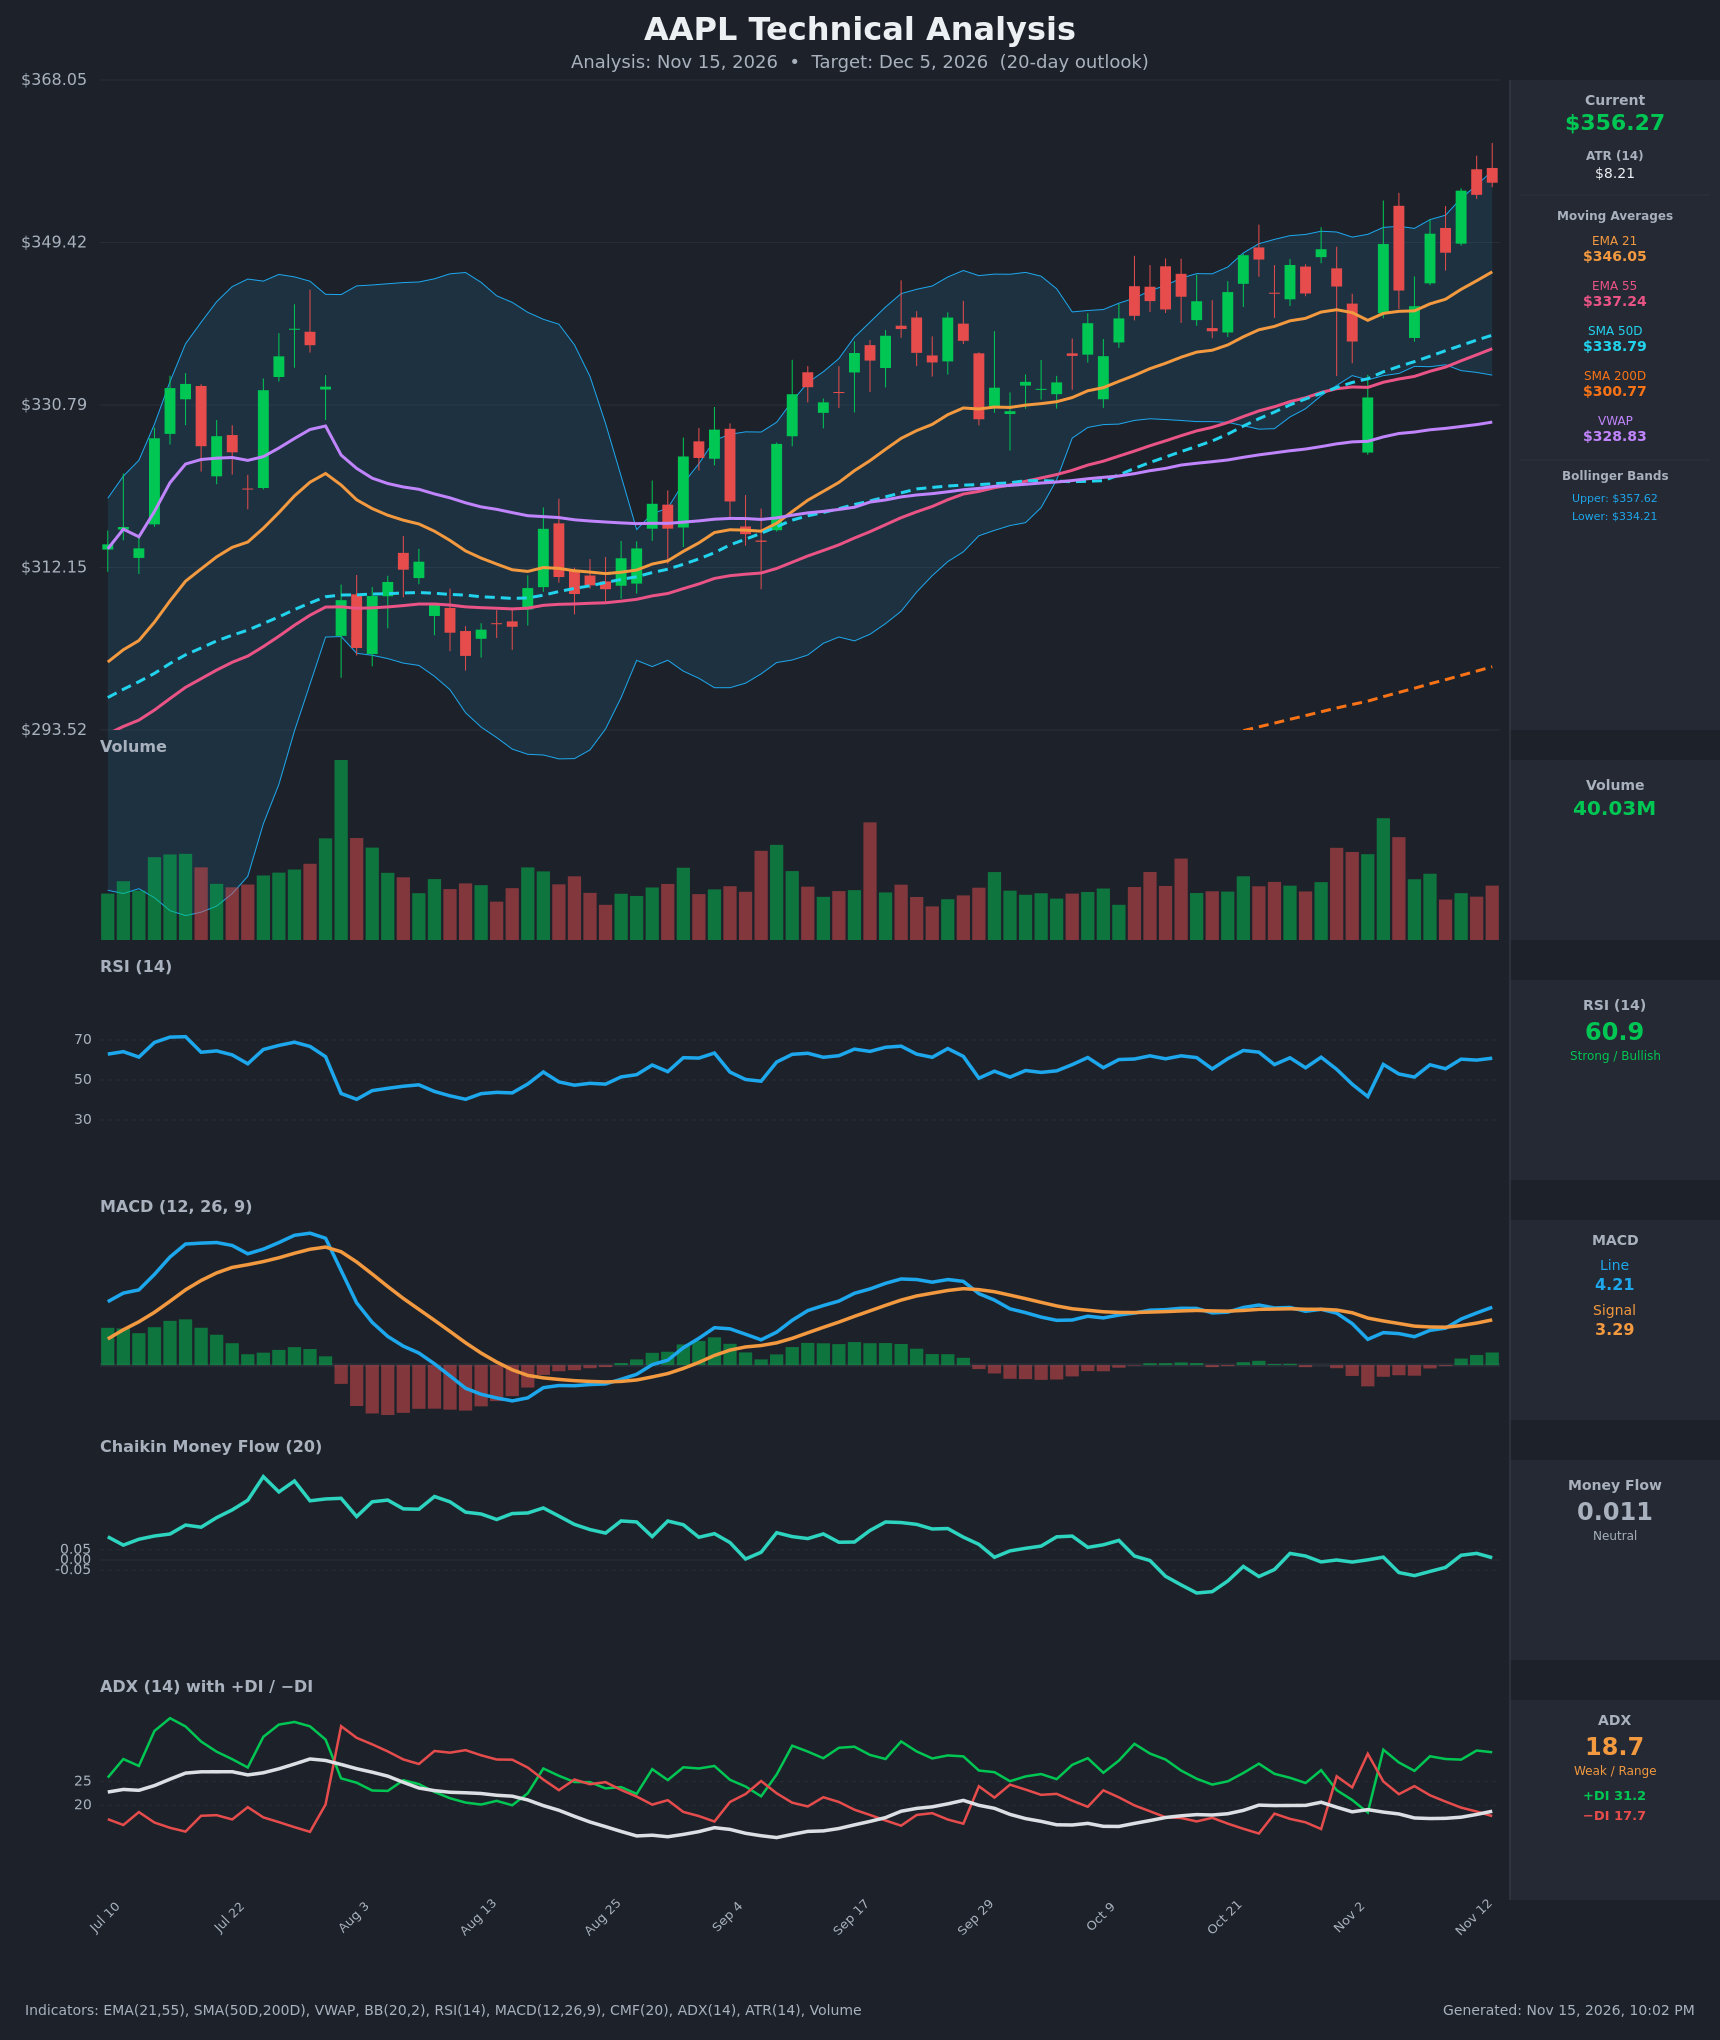
- RSI (14): 60.9, up from 51.5 on Nov 6. It is in bullish territory but below 70, so there is room to run. The Sep peak was around 66, so RSI is not yet confirming a new momentum high. [Bullish]
- 20 EMA: The EMA 21 is $346.05 and rising, with price about 3% above it. The EMA 21 is above the EMA 55 ($337.24), so the short-term trend is up. Price has not tested the EMA 21 since Nov 6. [Bullish]
- MACD: The line is 4.21 against a signal of 3.29, with a positive and expanding histogram. MACD crossed back above the signal on Nov 11, after sitting below it from Oct 30 to Nov 10. The line is still below its Aug peak, so momentum is only moderate. [Bullish]
- Bollinger Bands (20): Price at $356.27 sits just under the upper band ($357.62), with the lower band at $334.21 and a midline near $346. The price is "walking the band", which is typical of an uptrend. It is also stretched, so a pullback toward the midline is possible. [Bullish]
- CMF (20): 0.011, inside the ±0.05 neutral band and flat to slightly positive. It has dipped negative at times (-0.077 on Nov 6). The rally lacks strong accumulation behind it. [Neutral]
- ADX (14): 18.7, which is weak and range-like, but it has turned up from 17.2. +DI (31.2) is well above −DI (17.7), so bulls control direction even though trend strength is unconfirmed. [Weak Trend, Bullish direction]
- Volume: 40.03M, roughly average. The Nov 3 selloff and rebound came on heavier volume, and the latest advance is on ordinary volume. There is no strong volume surge confirming the breakout. [Neutral to mildly supportive]
Other trend context:
- SMA 50D: $338.79, above the SMA 200D at $300.77. A golden cross is already in place.
- Long-term trend: price is above the SMA 200D, which confirms a long-term uptrend.
- VWAP: $328.83 is well below price, a bullish positioning signal.
DIVERGENCES & TRENDS
- Mild participation divergence: price is making new highs (about $356), while CMF hovers near zero and ADX stays below 20. The rally has less conviction than the price level suggests.
- RSI: it has not exceeded its Sep high (~66) even as price made a higher high. This is a minor non-confirmation, not a true bearish divergence.
- Positive crossovers:
- MACD crossed bullishly on Nov 11.
- +DI re-took control after the Oct 30 to Nov 3 dip, when −DI briefly led.
- The EMA 21 is above the EMA 55 with all MAs stacked bullishly (price > EMA 21 > SMA 50D/EMA 55 > VWAP > SMA 200D).
- Pullback recovery: the Nov 3 low of $331.65 was bought sharply back to $349.24 the next day. That is a bullish shakeout and shows dip-buying.
- Trend: price has made a series of higher highs and higher lows since the Aug low near $312.
CHART PATTERNS
- Ascending staircase / rising channel: this is the dominant structure, with higher highs and higher lows along a steady slope. It resembles the Ascending Triangle continuation pattern only loosely, because there is no flat resistance. The channel is an uptrend continuation, with projected channel-top resistance around $365 to $375.
- Bullish pullback and recovery: the Nov 3 dip and rebound resembles a minor flag or shakeout within the trend.
- Caution: price is hugging the upper Bollinger Band with weak ADX. A Bearish Rising Wedge is not confirmed, but it would become a risk if momentum fades while price keeps grinding higher.
POTENTIAL SCENARIOS
- Scenario 1: Bullish Trend Continuation — Price holds above the EMA 21 and extends the staircase higher, helped by the fresh MACD crossover and +DI dominance. Trigger: a daily close above $358 (the upper Bollinger Band and recent wick highs). Target: $368 to $378. Invalidation: a daily close below $346 (EMA 21). (50% probability)
- Scenario 2: Neutral/Bearish Pullback to Support — The stretched price at the upper band, weak ADX and neutral CMF lead to a mean-reversion dip toward the EMA 21 and the Bollinger midline before buyers return. Trigger: a rejection near $357 to $362 with RSI rolling over from 60s. Target: $344 to $348. Invalidation: a daily close above $362. (35% probability)
- Scenario 3: Bearish Trend Break — A failed breakout, with price losing the EMA 21 and the SMA 50D on rising volume. Trigger: a close below $338. Target: $330 to $334 (lower Bollinger Band area and the Nov 3 low). Invalidation: a reclaim of $346. (15% probability)
PRICE TARGETS
- Target Price: $364.00 (20-day timeframe, about +2.2%; the trend is intact but the stretched price and weak ADX limit the upside)
- Expected Range: $343.00 to $378.00 (width $35, about 9.8% of current price)
- Key Levels: Support at $346.05 (EMA 21, with $338.79 SMA 50D below it), Resistance at $357.62 (upper Bollinger Band, with $365 to $370 above as the channel projection)
OVERALL BIAS
OVERALL BIAS: BULLISH - Price is above every moving average, with a golden cross in place, a fresh bullish MACD crossover, +DI well above −DI and RSI at 60.9 with room to run. Conviction is modest because ADX is weak (18.7), CMF is neutral and price is stretched at the upper Bollinger Band, so a dip toward $346 is possible along the way.
This is educational analysis and not financial advice.