AAPL 6-day bearish forecast — Nov 1, 2026
- Bias: Bearish
- Timeframe: 6 days (made Nov 1, 2026, target date Nov 6, 2026)
- Price at analysis: $344.79
- Price target: $341.80
- Expected range: $334.50 – $350.00
- Result: Correct (-0.7%) — closed at $342.37 on Nov 6, 2026; quality score 100/100
Get a free AI analysis of AAPL today
Analysis
TECHNICAL INDICATORS
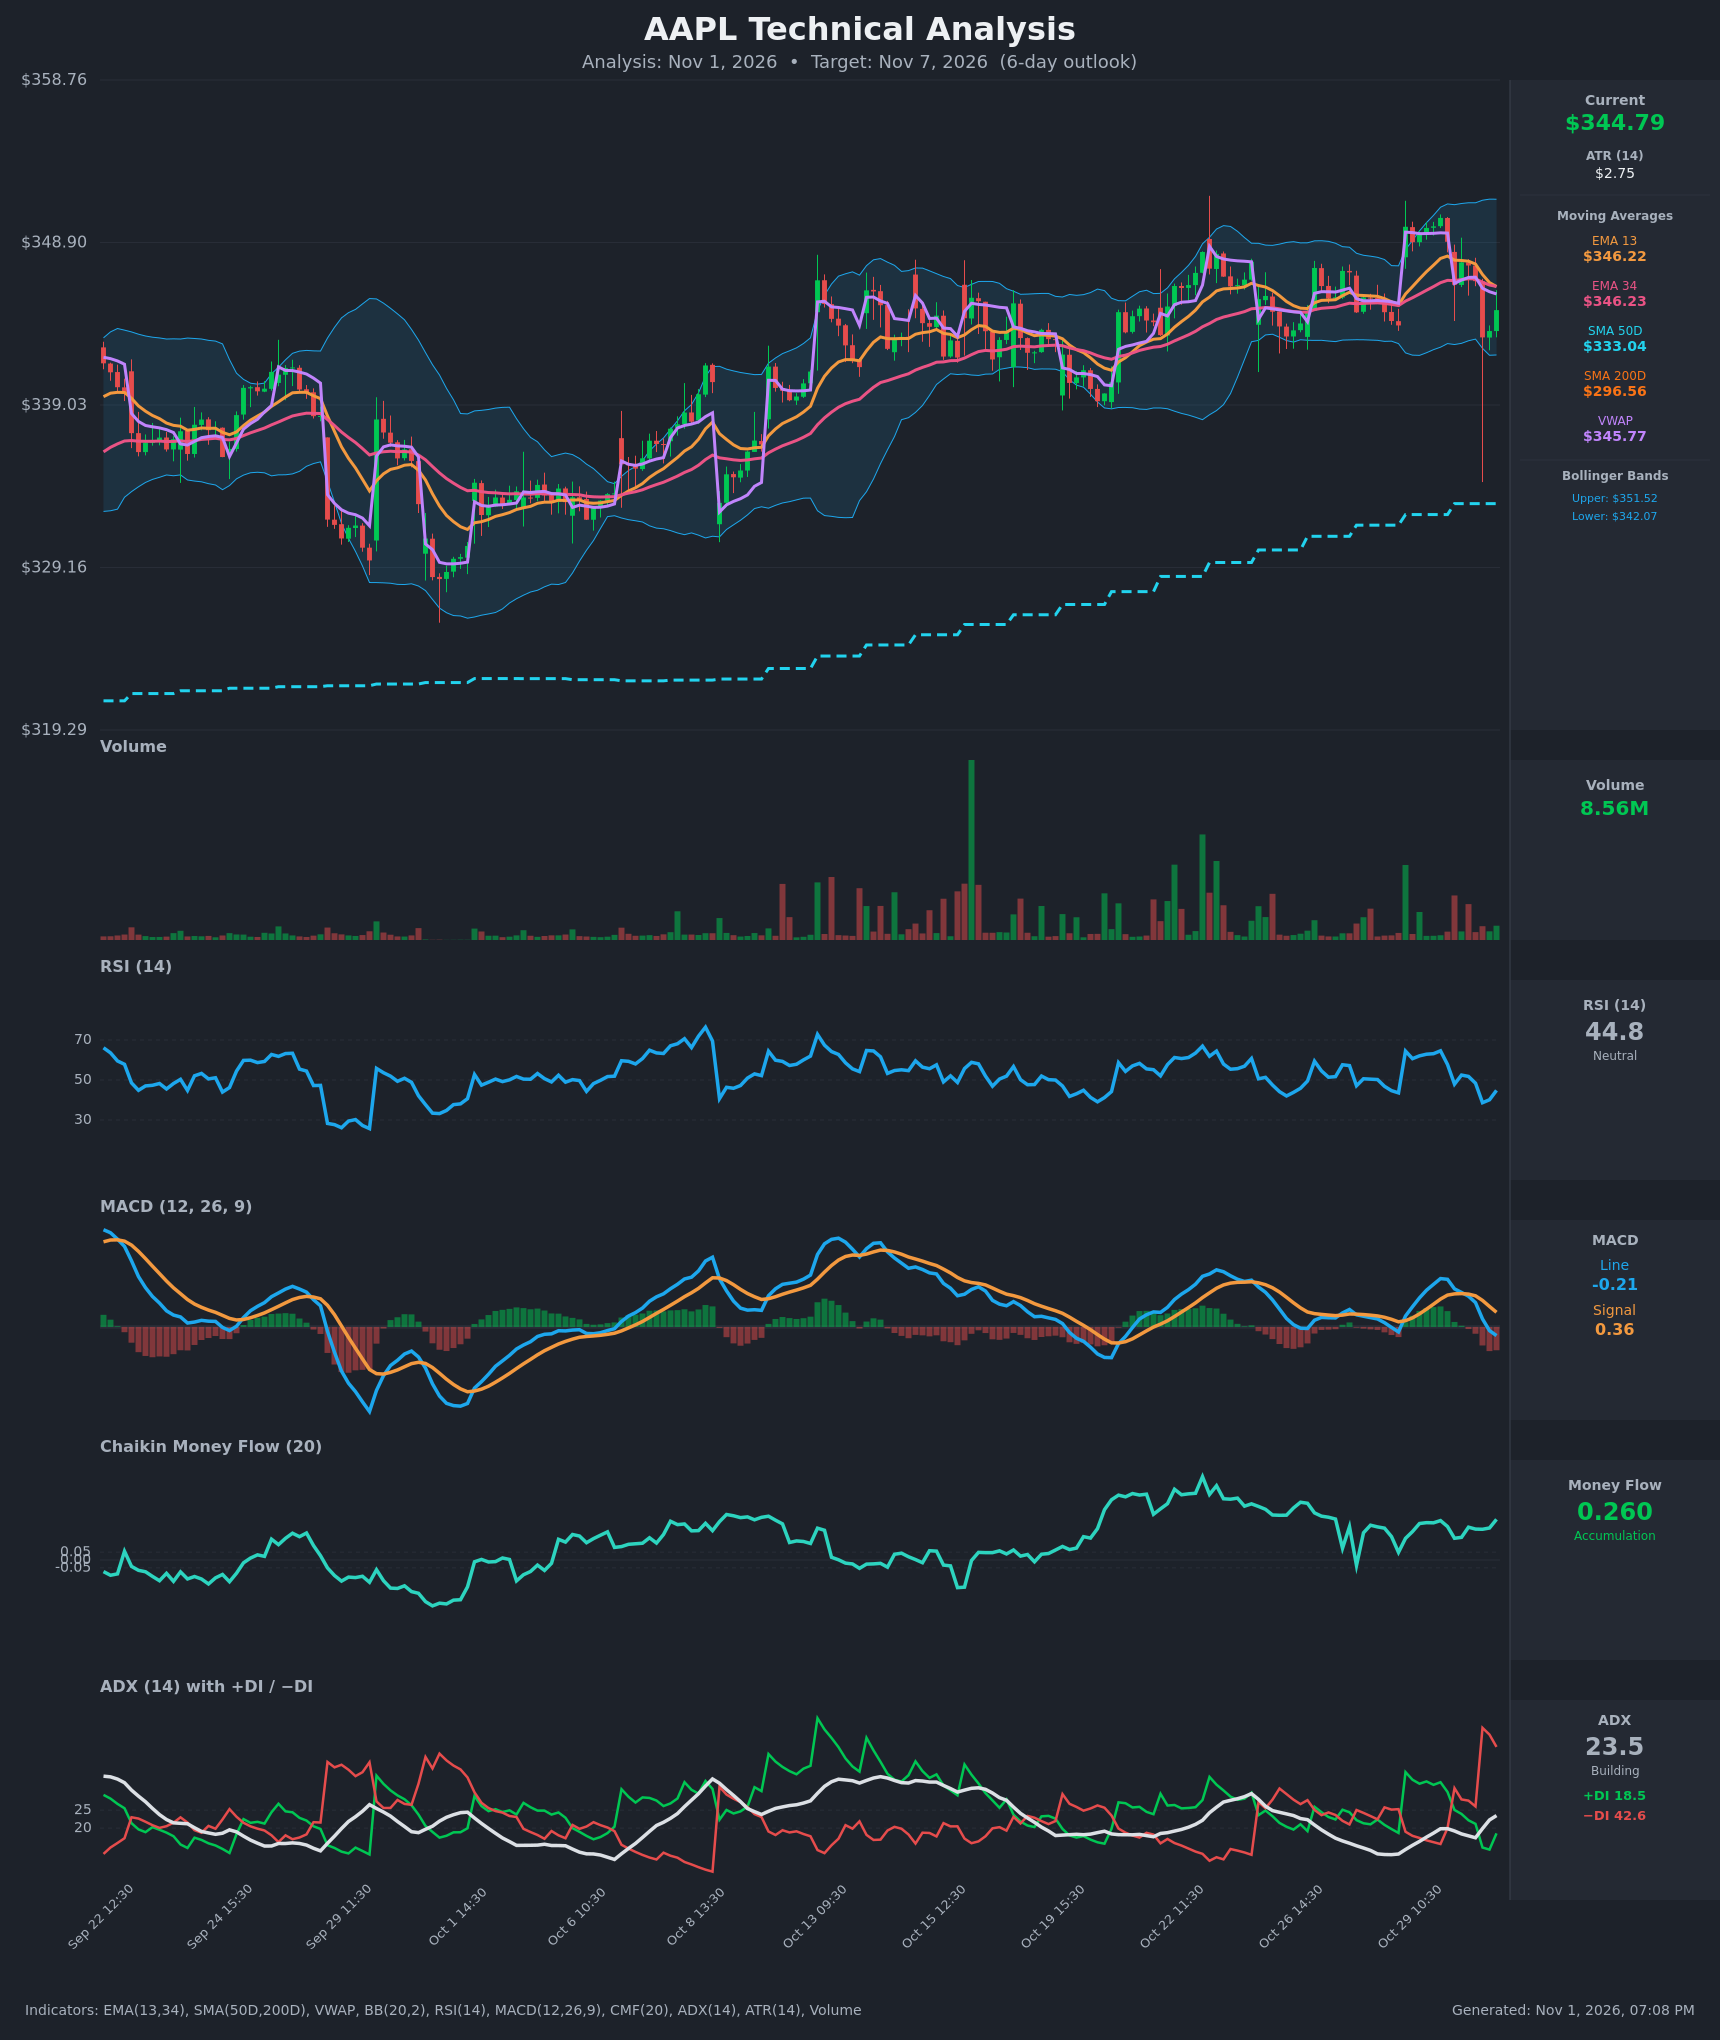
- RSI (14): 44.80, down from the low 60s on Oct 29 and bounced slightly off 38.7 on Oct 30. It sits below 50 with no oversold reading, so momentum is soft but not exhausted. [Bearish]
- 20 EMA: The data gives EMA13 at $346.22 and EMA34 at $346.23. Price at $344.79 is below both, and EMA13 has just crossed below EMA34. The cluster at about $346.2 is now overhead resistance. [Bearish]
- MACD: Line -0.213 is below Signal 0.360, with a negative histogram of about -0.57. The bearish crossover happened around Oct 30 14:30, and the line has crossed below zero. [Bearish]
- Bollinger Bands (20): Upper $351.52, lower $342.07, with price at $344.79 in the lower third of the band. Price rejected the upper band on Oct 29, and the bands are relatively narrow. The lower band at about $342 is the near-term test; a stretch of the move to it is plausible, but a bounce is also possible. [Neutral]
- CMF (20): 0.260, well above +0.05, and positive for about two weeks. Buying pressure and accumulation remain intact, which conflicts with the short-term price weakness. [Accumulation]
- ADX (14): 23.5 and rising, up from 17 earlier in the day, so a trend is developing but is not yet strong. −DI (42.6) is far above +DI (18.5), so sellers are clearly in control. [Moderate Trend, Bearish]
- Volume: 8.56M is moderate, with no climactic surge. The sharp Oct 30 sell-off was not matched by a spike in volume, so conviction is limited. [Neutral to Slightly Bearish]
DIVERGENCES & TRENDS
- Price vs. CMF: CMF at 0.26 is near its highs while price has dropped back to the lower half of its range. This is a mild bullish divergence in money flow, and it is the main reason not to expect a collapse.
- DI spread: −DI jumped from about 26 to 48 in one hour on Oct 30 and is still 24 points above +DI. This is a decisive short-term shift to sellers.
- MACD and EMA: The MACD bearish crossover and the EMA13/EMA34 bearish cross occurred within hours of each other, confirming short-term momentum loss.
- VWAP: Price at $344.79 is below VWAP at $345.77 after trading above it on Oct 29. This marks a change from buying pressure to selling pressure.
- Long-term trend: Price is far above SMA50D ($333.04) and SMA200D ($296.56), with SMA50D well above SMA200D. The long-term uptrend is intact, which limits the depth of a pullback. The first deeper support is the rising SMA50D.
- Failed breakout: The Oct 29 gap up to about $350 was fully reversed within a day, which is a short-term bearish reversal signal.
CHART PATTERNS
- Bearish Double Top (reversal): Highs near $350 on Oct 22 and Oct 29 both failed at the upper Bollinger Band, with a neckline around $342 to $343 (the recent lows and lower band). Price is now approaching that neckline. A confirmed break below it gives a measured target of roughly $333 to $334 ($350.4 − $342.5 = about $8 projected down). Over 6 days, a partial move toward $338 to $341 is more realistic.
- Range/rectangle context: Price has traded between about $342 and $350 for two weeks, so a failed neckline break would simply keep price in this range.
- The pattern is not yet confirmed, because the neckline has not broken on a closing basis.
POTENTIAL SCENARIOS
- Scenario 1: Bearish Neckline Break / Double-Top Follow-Through — Sellers (−DI 42.6 vs. +DI 18.5), the MACD cross and the loss of the EMA/VWAP cluster push price down through the lower Bollinger Band. Trigger: closing break below $342.00. Target: $338.50, then $334 to $335 if the break extends. Invalidation: a close back above $346.25 (EMA13/34 cluster). (50% probability)
- Scenario 2: Neutral Range Chop — CMF accumulation and the intact long-term trend keep price in the $342 to $348 box. Trigger: lower band at $342 holds on a closing basis. Target: $343 to $347. Invalidation: a close outside the $341.50 to $349 range. (25% probability)
- Scenario 3: Bullish Mean-Reversion Bounce — Accumulation (CMF 0.26) fuels a bounce from the lower band, reclaiming the EMAs and VWAP. Trigger: close above $346.25 with rising volume. Target: $350 to $351.50 (upper band and double-top highs). Invalidation: a close below $342.00. (25% probability)
PRICE TARGETS
- Target Price: $341.80 (6-day horizon)
- Expected Range: $334.50 to $350.00 (width $15.50, about 4.5% of the current price, consistent with a 6-day horizon)
- Key Levels: Support at $342.07 (lower Bollinger Band), then $338.50 and $333.04 (SMA50D); Resistance at $346.23 (EMA cluster), then $350.40 (double-top highs)
OVERALL BIAS
OVERALL BIAS: BEARISH - Sellers dominate (−DI 42.6 vs. +DI 18.5, ADX rising), MACD and EMA13/34 have crossed bearishly, and price is below VWAP, with a possible double top capped near $350. CMF accumulation and the strong long-term uptrend (price far above SMA50D and SMA200D) limit the expected downside, so conviction is modest.
This is educational analysis and not financial advice.