ORCL 6-day bearish forecast — Nov 1, 2026
- Bias: Bearish
- Timeframe: 6 days (made Nov 1, 2026, target date Nov 6, 2026)
- Price at analysis: $130.69
- Price target: $128.80
- Expected range: $126.00 – $134.50
- Result: Correct (-11.2%) — closed at $116.10 on Nov 6, 2026; quality score 50/100
Get a free AI analysis of ORCL today
Analysis
TECHNICAL INDICATORS
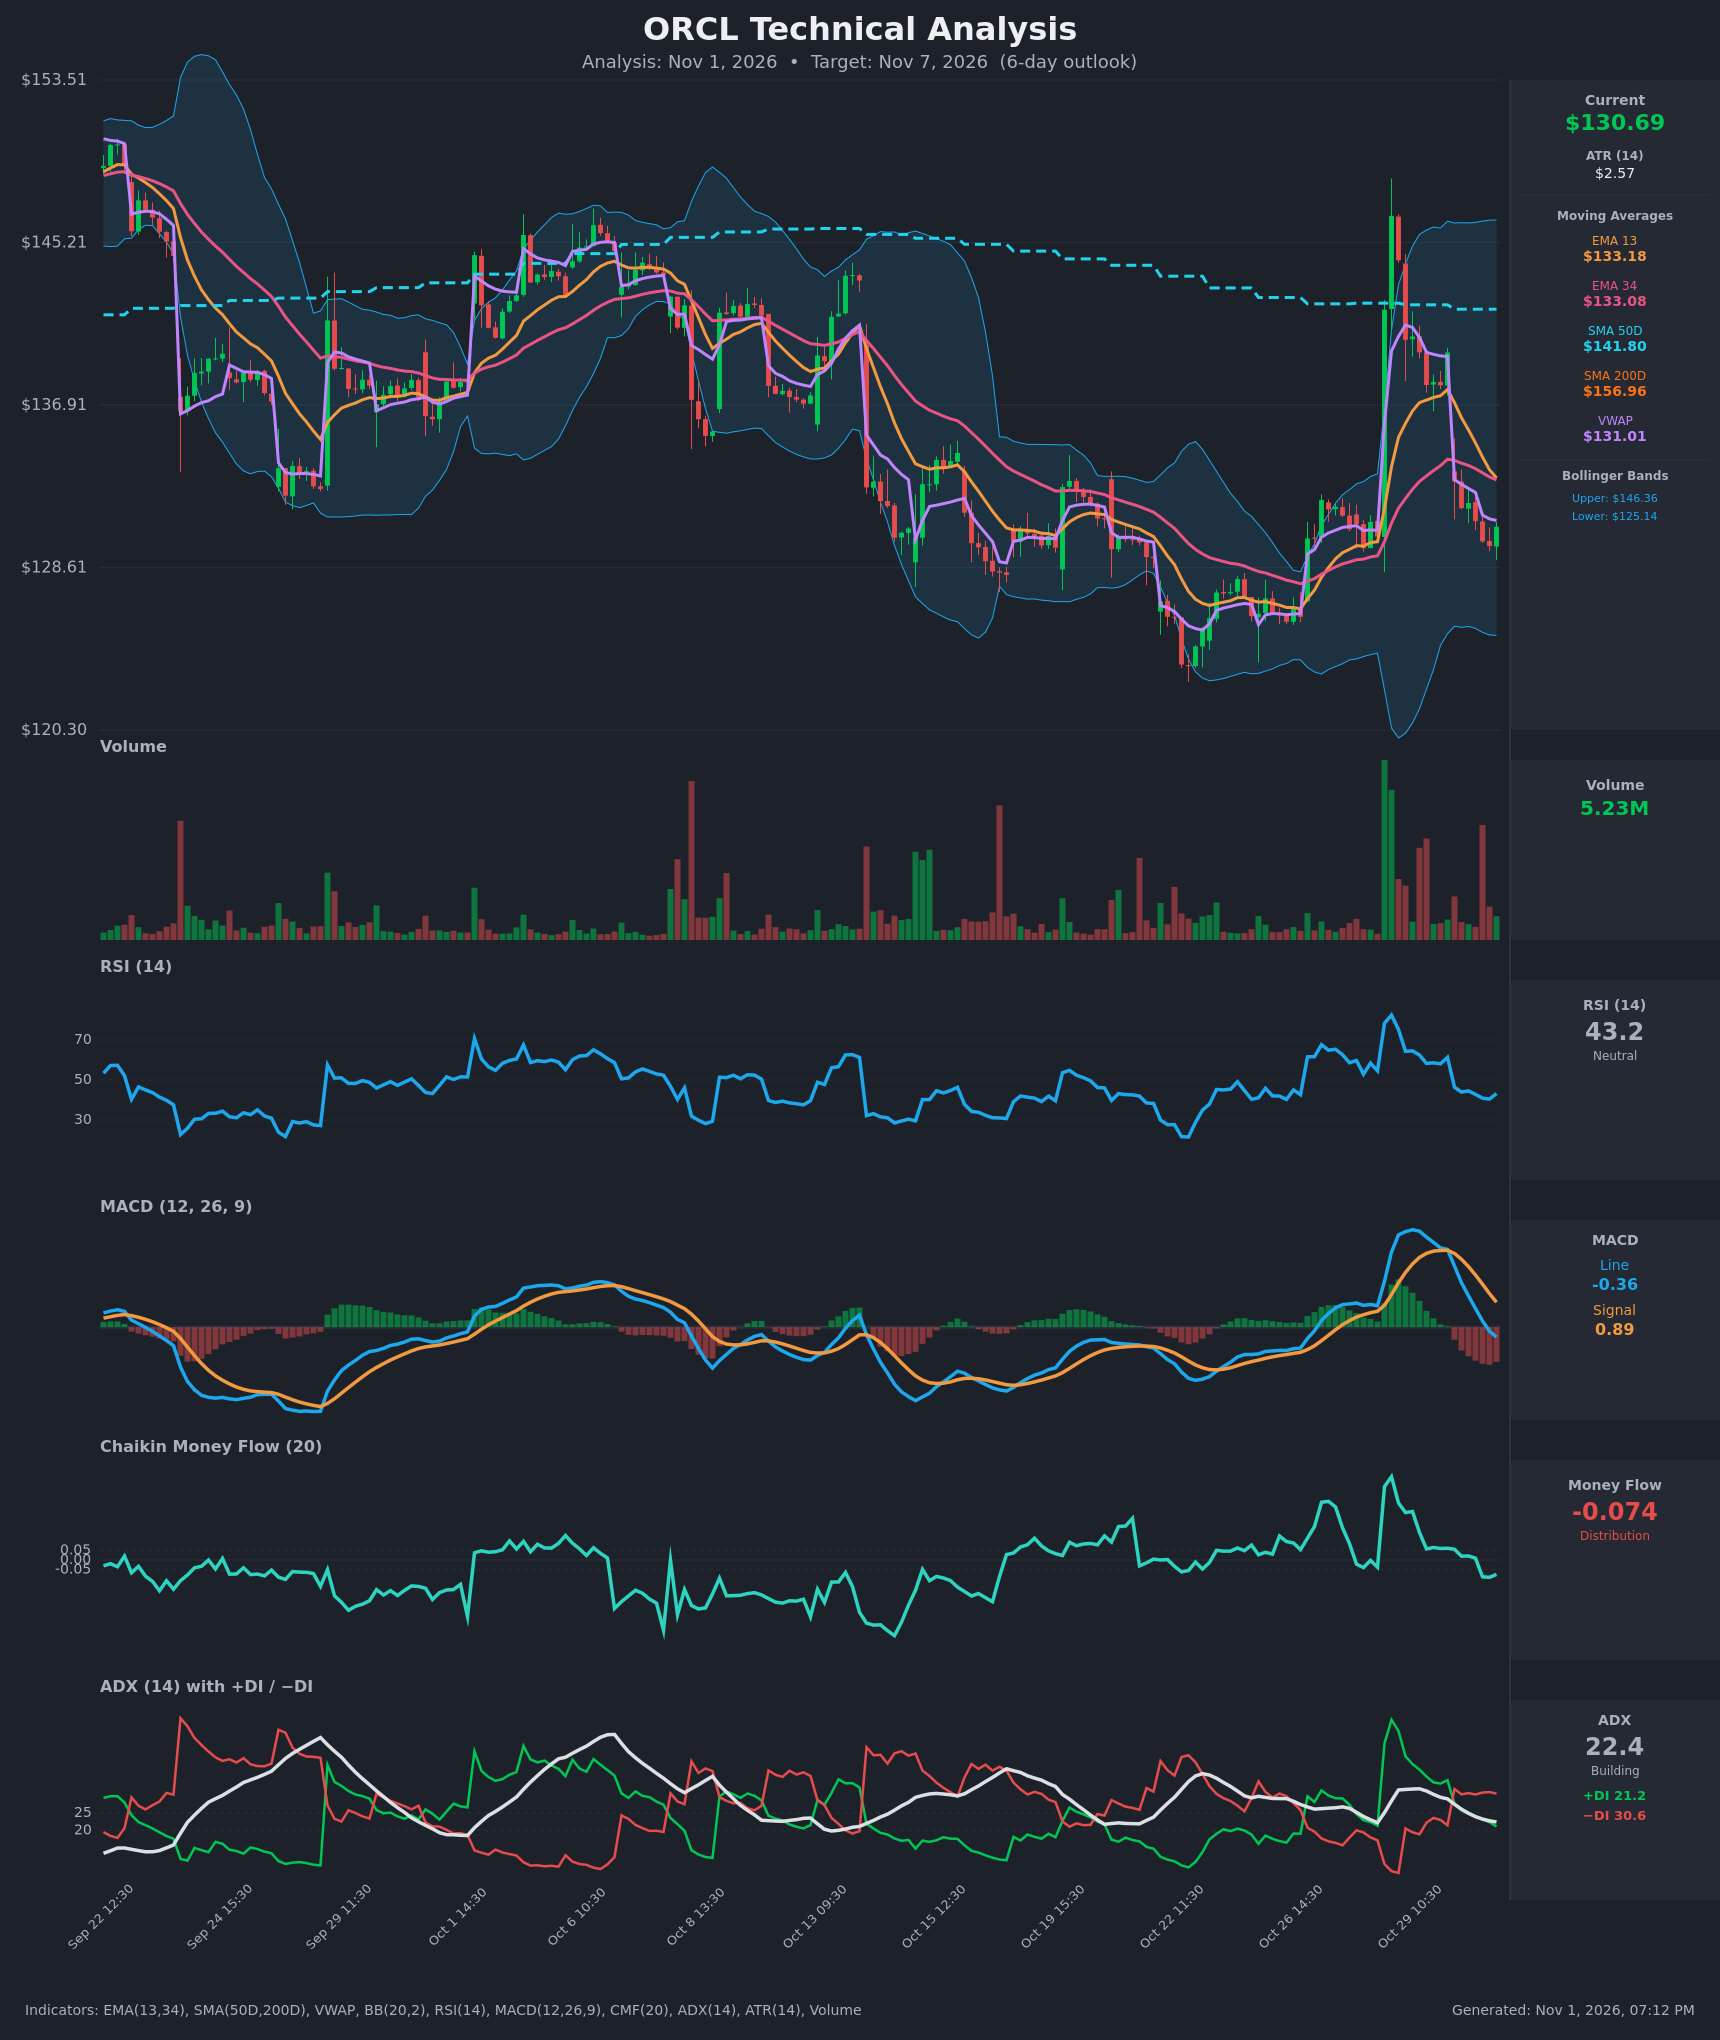
- RSI (14): 43.24, below the 50 midline and recovering slightly from 40.5 after falling from 75 on Oct 28. It is not oversold, so there is room to fall further. Momentum is bearish-leaning. [Bearish]
- 20 EMA: The supplied values are EMA13 $133.18 and EMA34 $133.08. Price at $130.69 is below both, and the two are nearly converged with EMA13 rolling over. Both now act as overhead resistance in the $133 area. [Bearish]
- MACD: Line -0.36 is below signal 0.89, a bearish crossover that occurred around Oct 30 13:30–14:30. The histogram is negative and expanding, the line has just crossed below zero, and both lines are falling from the late-October peak near +3.5. [Bearish]
- Bollinger Bands (20): Upper $146.36, lower $125.14, midline about $135.75. Price at $130.69 sits in the lower half of the bands, about 26% of the width above the lower band. The bands are wide after the Oct 28 spike, which suggests high volatility. Price is trending toward the lower band without being at an extreme. [Bearish]
- CMF (20): -0.074, below the -0.05 threshold. It has fallen from +0.295 on Oct 28 to negative, showing a clear shift from accumulation to distribution. [Distribution]
- ADX (14): 22.4 and falling from 32, so trend strength is fading and sits in the borderline zone. −DI at 30.6 is above +DI at 21.2, so bears are in control. The −DI/+DI crossover happened on Oct 30 morning. [Weak Trend + Bearish direction]
- Volume: 5.23M on the latest bar, moderate. The large spike on Oct 28 was a one-off blowoff, and the selling since has come on average to slightly elevated volume. Price is below VWAP ($131.01), which is a mild sign of selling pressure. [Mild selling pressure / Bearish]
DIVERGENCES & TRENDS
- No clear divergence. RSI, MACD and CMF all confirm the price decline from $144 to $130.
- The Oct 28 spike to $144 was fully retraced within two sessions. This looks like a failed breakout, or a gap-fill rejection near the SMA50 ($141.80).
- Price is far below the SMA200 ($156.96) and SMA50 ($141.80). The SMA50 is below the SMA200 (death cross structure), so the long-term trend is bearish.
- The MACD bearish crossover and the −DI over +DI crossover are fresh and confirm the short-term downturn.
- The EMA13/EMA34 are nearly flat and converging, and a bearish EMA cross is imminent.
- The October low is around $122–$123, which is the key downside zone.
CHART PATTERNS
- The broader chart shows a lower-high sequence since late September: $150 → $146 → $144 with a lower-low base near $122. This is a loose Bearish Descending Triangle / Bearish Expanding structure, not a clean match.
- The recent spike and fade resembles a failed reversal. The lower-high at $144 below the SMA50 supports continuation of the downtrend.
- The measured downside target is the October low near $122–$123, with the lower Bollinger Band at $125 as an interim target.
- No pattern is clean enough to override the indicators, so confidence is moderate.
POTENTIAL SCENARIOS
- Scenario 1: Bearish Continuation Lower — Price stays below the converged EMAs and VWAP, and the bearish MACD and DI readings drive a grind toward the lower band. Trigger: break below $129.70 (the recent low). Target: $126.00, then $125.14 (lower band). Invalidation: close above $133.20 (EMA cluster). (50% probability)
- Scenario 2: Neutral Range Chop — Price consolidates between the recent low and the EMA cluster as ADX fades below 20. Trigger: holds $128–$133 with declining volume. Target: $130–$132. Invalidation: a decisive close outside $128–$134. (28% probability)
- Scenario 3: Bullish Relief Bounce — An oversold-type bounce reclaims the EMAs and fills part of the gap down. Trigger: close above $133.20 with CMF turning positive. Target: $136.00–$138.00 (Bollinger midline, prior gap). Invalidation: failure at $133–$134 and a break back below $130. (22% probability)
PRICE TARGETS
For the 6-day timeframe, the range width should be about 4–8% of the current price. The Expected Range is $126.00 to $134.50, a width of $8.50 or 6.5%, which falls within that guidance.
- Target Price: $128.80
- Expected Range: $126.00 to $134.50
- Key Levels: Support at $125.14, Resistance at $133.18
OVERALL BIAS
OVERALL BIAS: BEARISH - Price is below all key moving averages and VWAP, MACD has crossed bearishly, −DI leads +DI, and CMF has moved into distribution. The failed Oct 28 spike also supports a drift toward the lower Bollinger Band, though the weakening ADX limits conviction.
This is educational analysis and not financial advice.