ORCL 48-day bearish forecast — Nov 15, 2026
- Bias: Bearish
- Timeframe: 48 days (made Nov 15, 2026, target date Jan 1, 2027)
- Price at analysis: $125.35
- Price target: $120.50
- Expected range: $111.00 – $130.00
- Result: Pending — graded after the close on Jan 1, 2027
Get a free AI analysis of ORCL today
Analysis
TECHNICAL INDICATORS
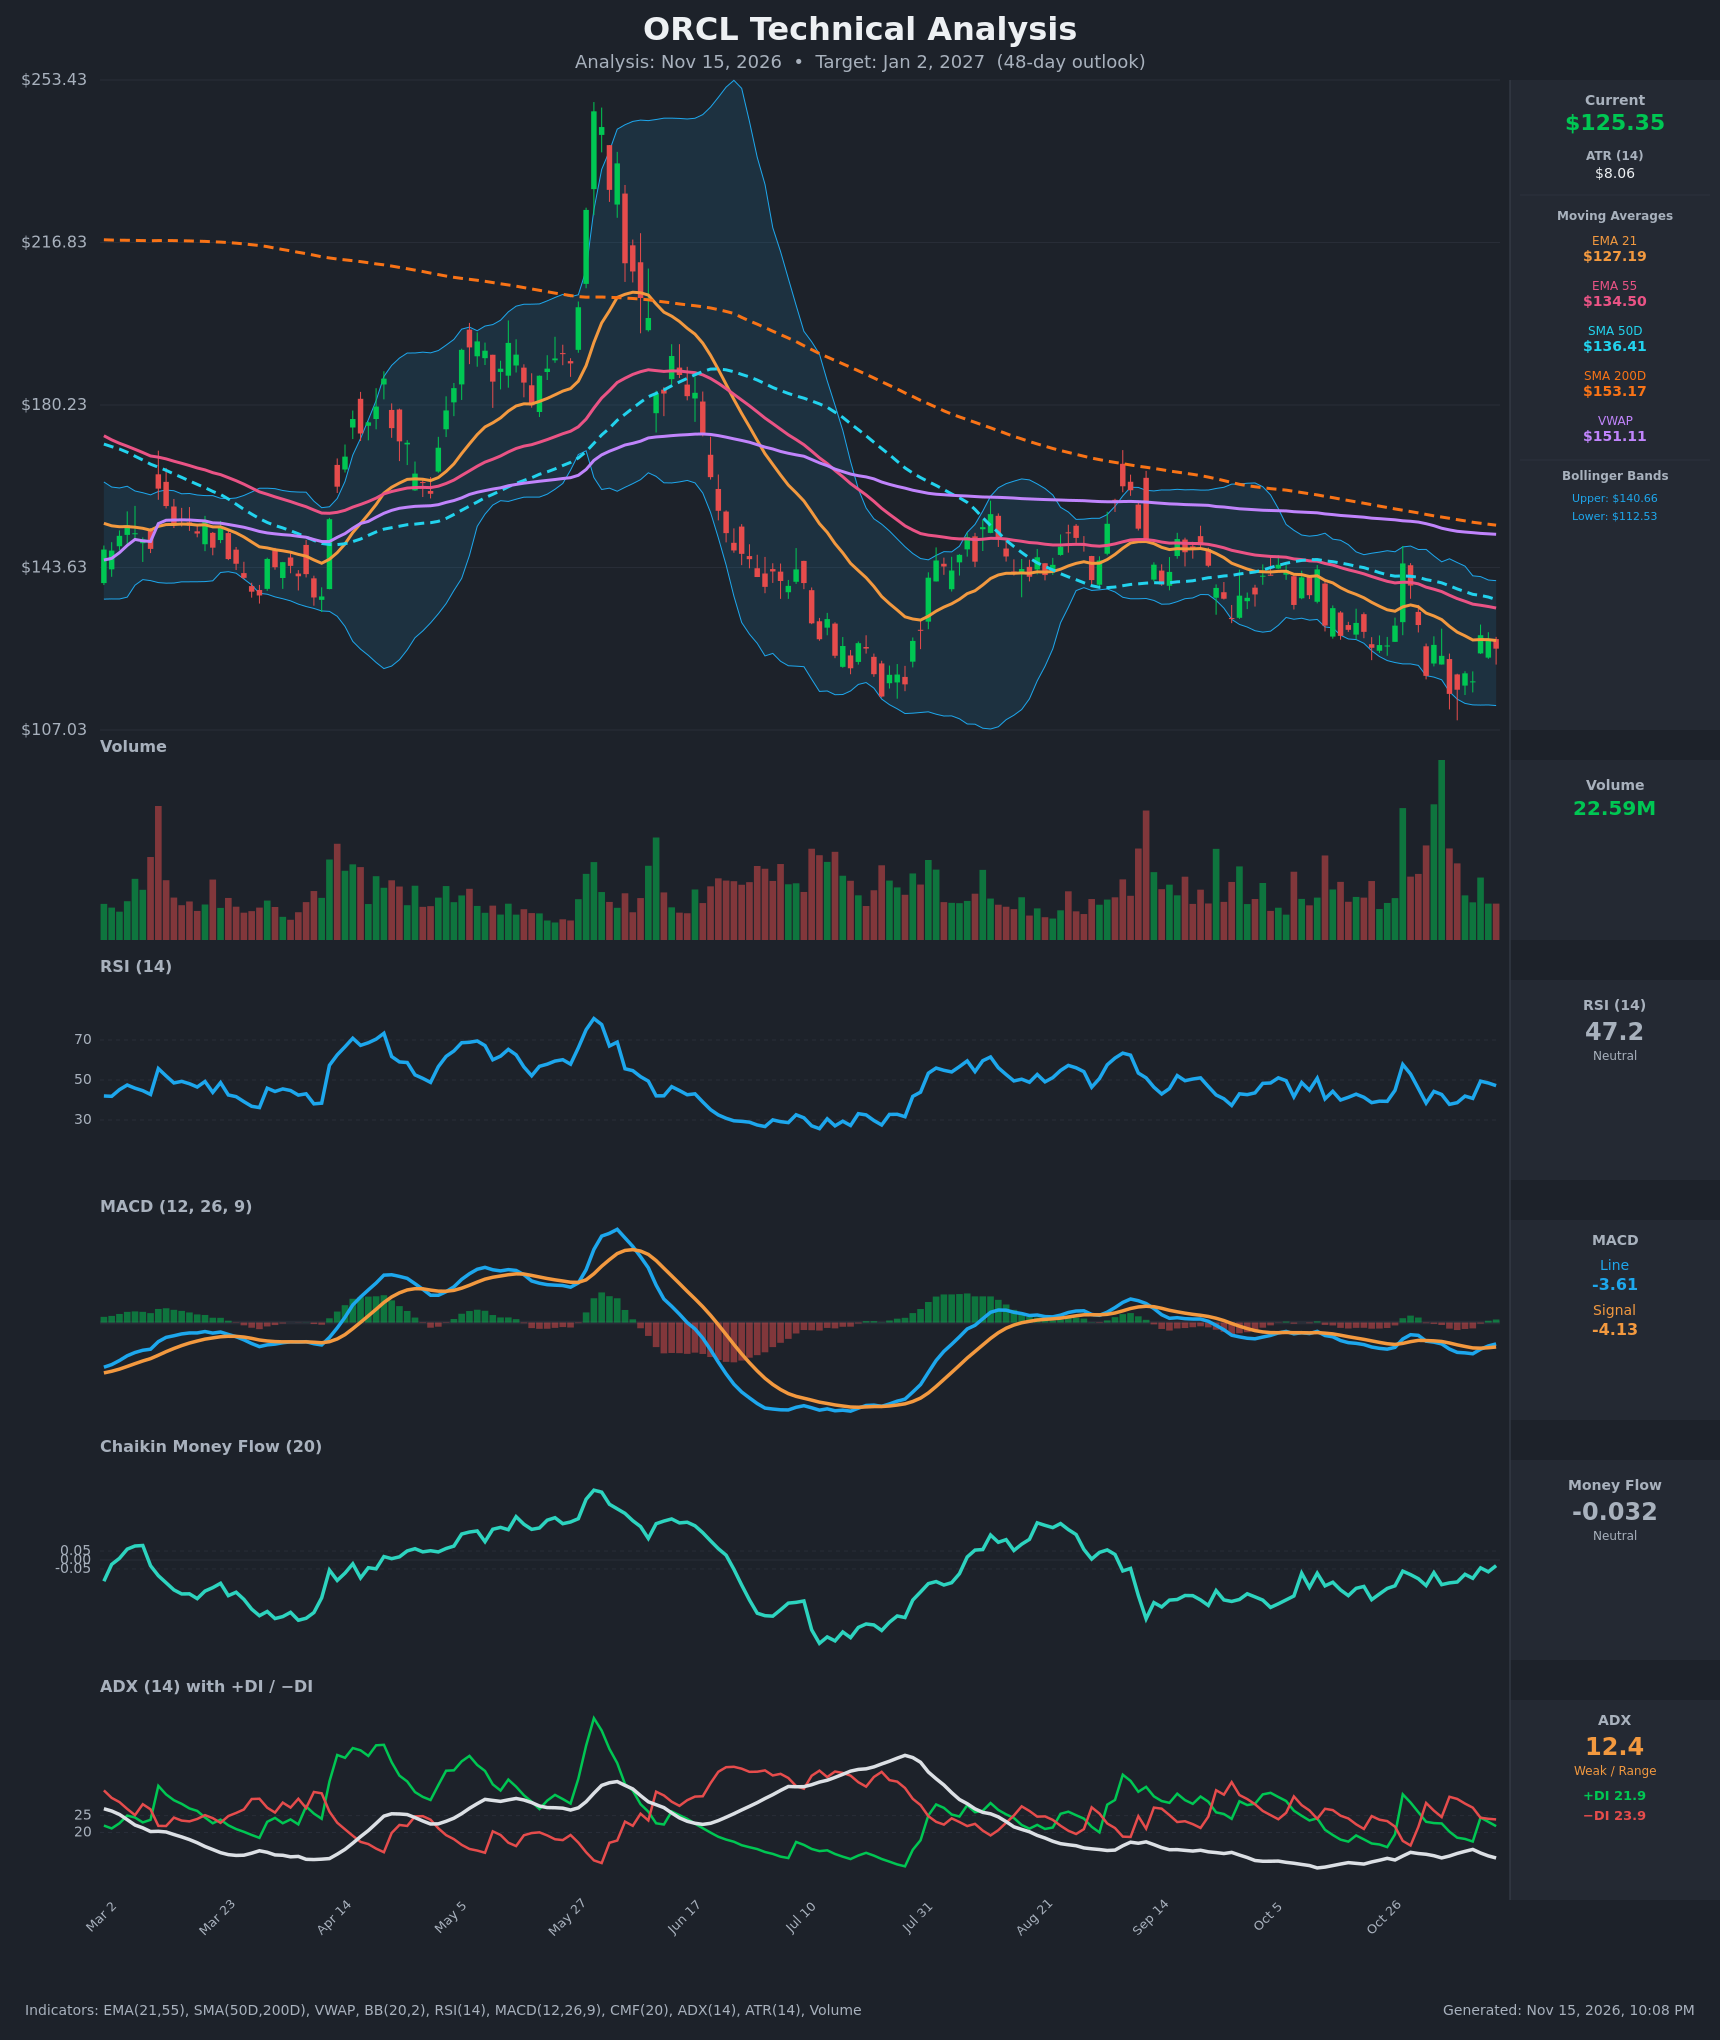
- RSI (14): 47.17, mid-range and neutral. It rebounded from 37.8 (Nov 5) to 49.4 (Nov 11) but has rolled over to 47.2 and failed to reclaim 50. It is not oversold, so there is no strong mean-reversion signal. [Neutral]
- 20 EMA (EMA 21): $127.19, with price at $125.35 just below it. The EMA is falling (from $134 in late Oct) and acting as dynamic resistance. EMA 21 is also well below EMA 55 ($134.50), a bearish stack. [Bearish]
- MACD: Line -3.615 is above signal -4.128, a small positive histogram of about +0.51. The bullish crossover occurred around Nov 11-12 and the histogram is improving. Both lines are still deep below zero, so this is a bounce within a downtrend rather than a trend reversal. [Neutral]
- Bollinger Bands (20): Upper $140.66, lower $112.53, midline about $126.6. Price sits just below the midline and the bands are fairly wide (about 22% of price), which reflects the recent volatility. The bands are sloping down, and price has been walking the lower half of the range since September. Support is near the lower band and resistance at the midline and EMA 21. [Bearish]
- CMF (20): -0.032, between the ±0.05 thresholds. It has improved from -0.159 (Oct 26) but has been mostly sub-zero for months, so there is no real accumulation. [Neutral]
- ADX (14): 12.4 (weak, below 20) with -DI 23.9 above +DI 21.9. The two DI lines are nearly converged. There is no trend strength, but the slight edge goes to sellers. [Weak Trend, slightly bearish]
- Volume: 22.59M, with recent bars lower than the spike days of late Oct and early Nov. The highest volume came on the large Oct 28 rally (+10%) and the sell-offs (Oct 30, Nov 2, Nov 5). Heavy volume on both big up and down days points to a volatile, two-sided market. Volume is now fading as price stalls under EMA 21. [Neutral / indecisive]
DIVERGENCES & TRENDS
- Moving average structure: Price is below EMA 21, EMA 55, SMA 50D ($136.41), SMA 200D ($153.17) and VWAP ($151.11). SMA 50D is below SMA 200D (a death cross already in force), and all the averages are sloping down. This is a clear long-term downtrend.
- MACD: It crossed above its signal on Nov 11-12, with the histogram turning slightly positive. The Nov 5 price low of $115.16 and the Nov 10 close of $117.98 set a higher low versus the early-Nov lows, but there is no clean divergence. RSI made a higher low (37.8 to 40.8) alongside it, which hints at mild stabilization.
- RSI/CMF: Both have trended up from their early-Nov lows but remain capped around neutral. They are not confirming a new uptrend.
- ADX/DI: ADX at 12-15 for weeks signals a directionless, choppy market. The DI lines crossed up on Oct 28 (+DI 31), then flipped back to -DI dominance on Nov 2. +DI and -DI were briefly equal on Nov 11. This is a coin-flip with a bearish tilt.
- Price action: Lower highs (about $144.5 on Oct 28, then $128.4 on Nov 11) and lower lows over the past months. The last two weeks have been a volatile $115-$130 range under falling resistance.
CHART PATTERNS
- Primary pattern: a prolonged downtrend of lower highs and lower lows, with price capped by a descending EMA 21/55 and SMA 50D. The recent $115-$130 chop resembles a Bearish Flag/Pennant continuation (see the reference diagram), though it is not textbook because the ranges are wide and volatile.
- Alternative reading: a possible Bullish Double Bottom near $115 (the Nov 5 low and a retest). It would only be confirmed by a close above the neckline at roughly $128-$130.5, which is also where EMA 21 and the Oct 27/30 closes sit.
- Targets: A breakdown below $115 projects a measured move to roughly $108-$110, near the chart's lower extreme. A double-bottom confirmation above $130.5 projects to about $136-$140 (SMA 50D and the upper Bollinger Band).
POTENTIAL SCENARIOS
- Scenario 1: Bearish Downtrend Continuation — Price continues to be rejected at EMA 21 / the $128-$131 zone, and sellers (−DI) push it back to retest the Nov 5 low, then break lower as the death-cross trend persists. Trigger: failure at $127-$131 and a close below $115.16. Target: $110-$112, with a drift-down mean around $120.50 at the 48-day mark. Invalidation: daily close above $131 with MACD histogram rising. (45% probability)
- Scenario 2: Neutral Range Chop — Price oscillates between $115 and $131 with ADX staying under 20, ending near the current level. Trigger: holds above $115 while capped under $131. Target: $120-$128. Invalidation: a close outside the $115-$131 range. (22% probability)
- Scenario 3: Bullish Relief Rally / Double Bottom — The MACD crossover and higher RSI low lead to a break above the EMA 21 and the $130.5 neckline, with price squeezing up toward the declining SMA 50D / EMA 55. Trigger: close above $130.50 on expanding volume. Target: $136-$140. Invalidation: loss of $120 after the breakout attempt. (33% probability)
PRICE TARGETS
- Target Price: $120.50 (48-day horizon, about -3.9% from $125.35)
- Expected Range: $111.00 to $130.00 (width $19 = about 15.2%, consistent with the 30-60 day guidance)
- Key Levels: Support at $115.16, Resistance at $130.50
OVERALL BIAS
OVERALL BIAS: BEARISH - Price is below every moving average and VWAP, the death cross is in place, −DI is above +DI, and rallies keep failing at EMA 21 and lower highs. The MACD crossover and stabilizing RSI limit conviction to modest, so bounces toward $130 are possible before the downtrend resumes.
This is educational analysis and not financial advice.