ORCL 27-day bearish forecast — Nov 15, 2026
- Bias: Bearish
- Timeframe: 27 days (made Nov 15, 2026, target date Dec 11, 2026)
- Price at analysis: $125.35
- Price target: $121.00
- Expected range: $111.00 – $130.00
- Result: Pending — graded after the close on Dec 11, 2026
Get a free AI analysis of ORCL today
Analysis
TECHNICAL INDICATORS
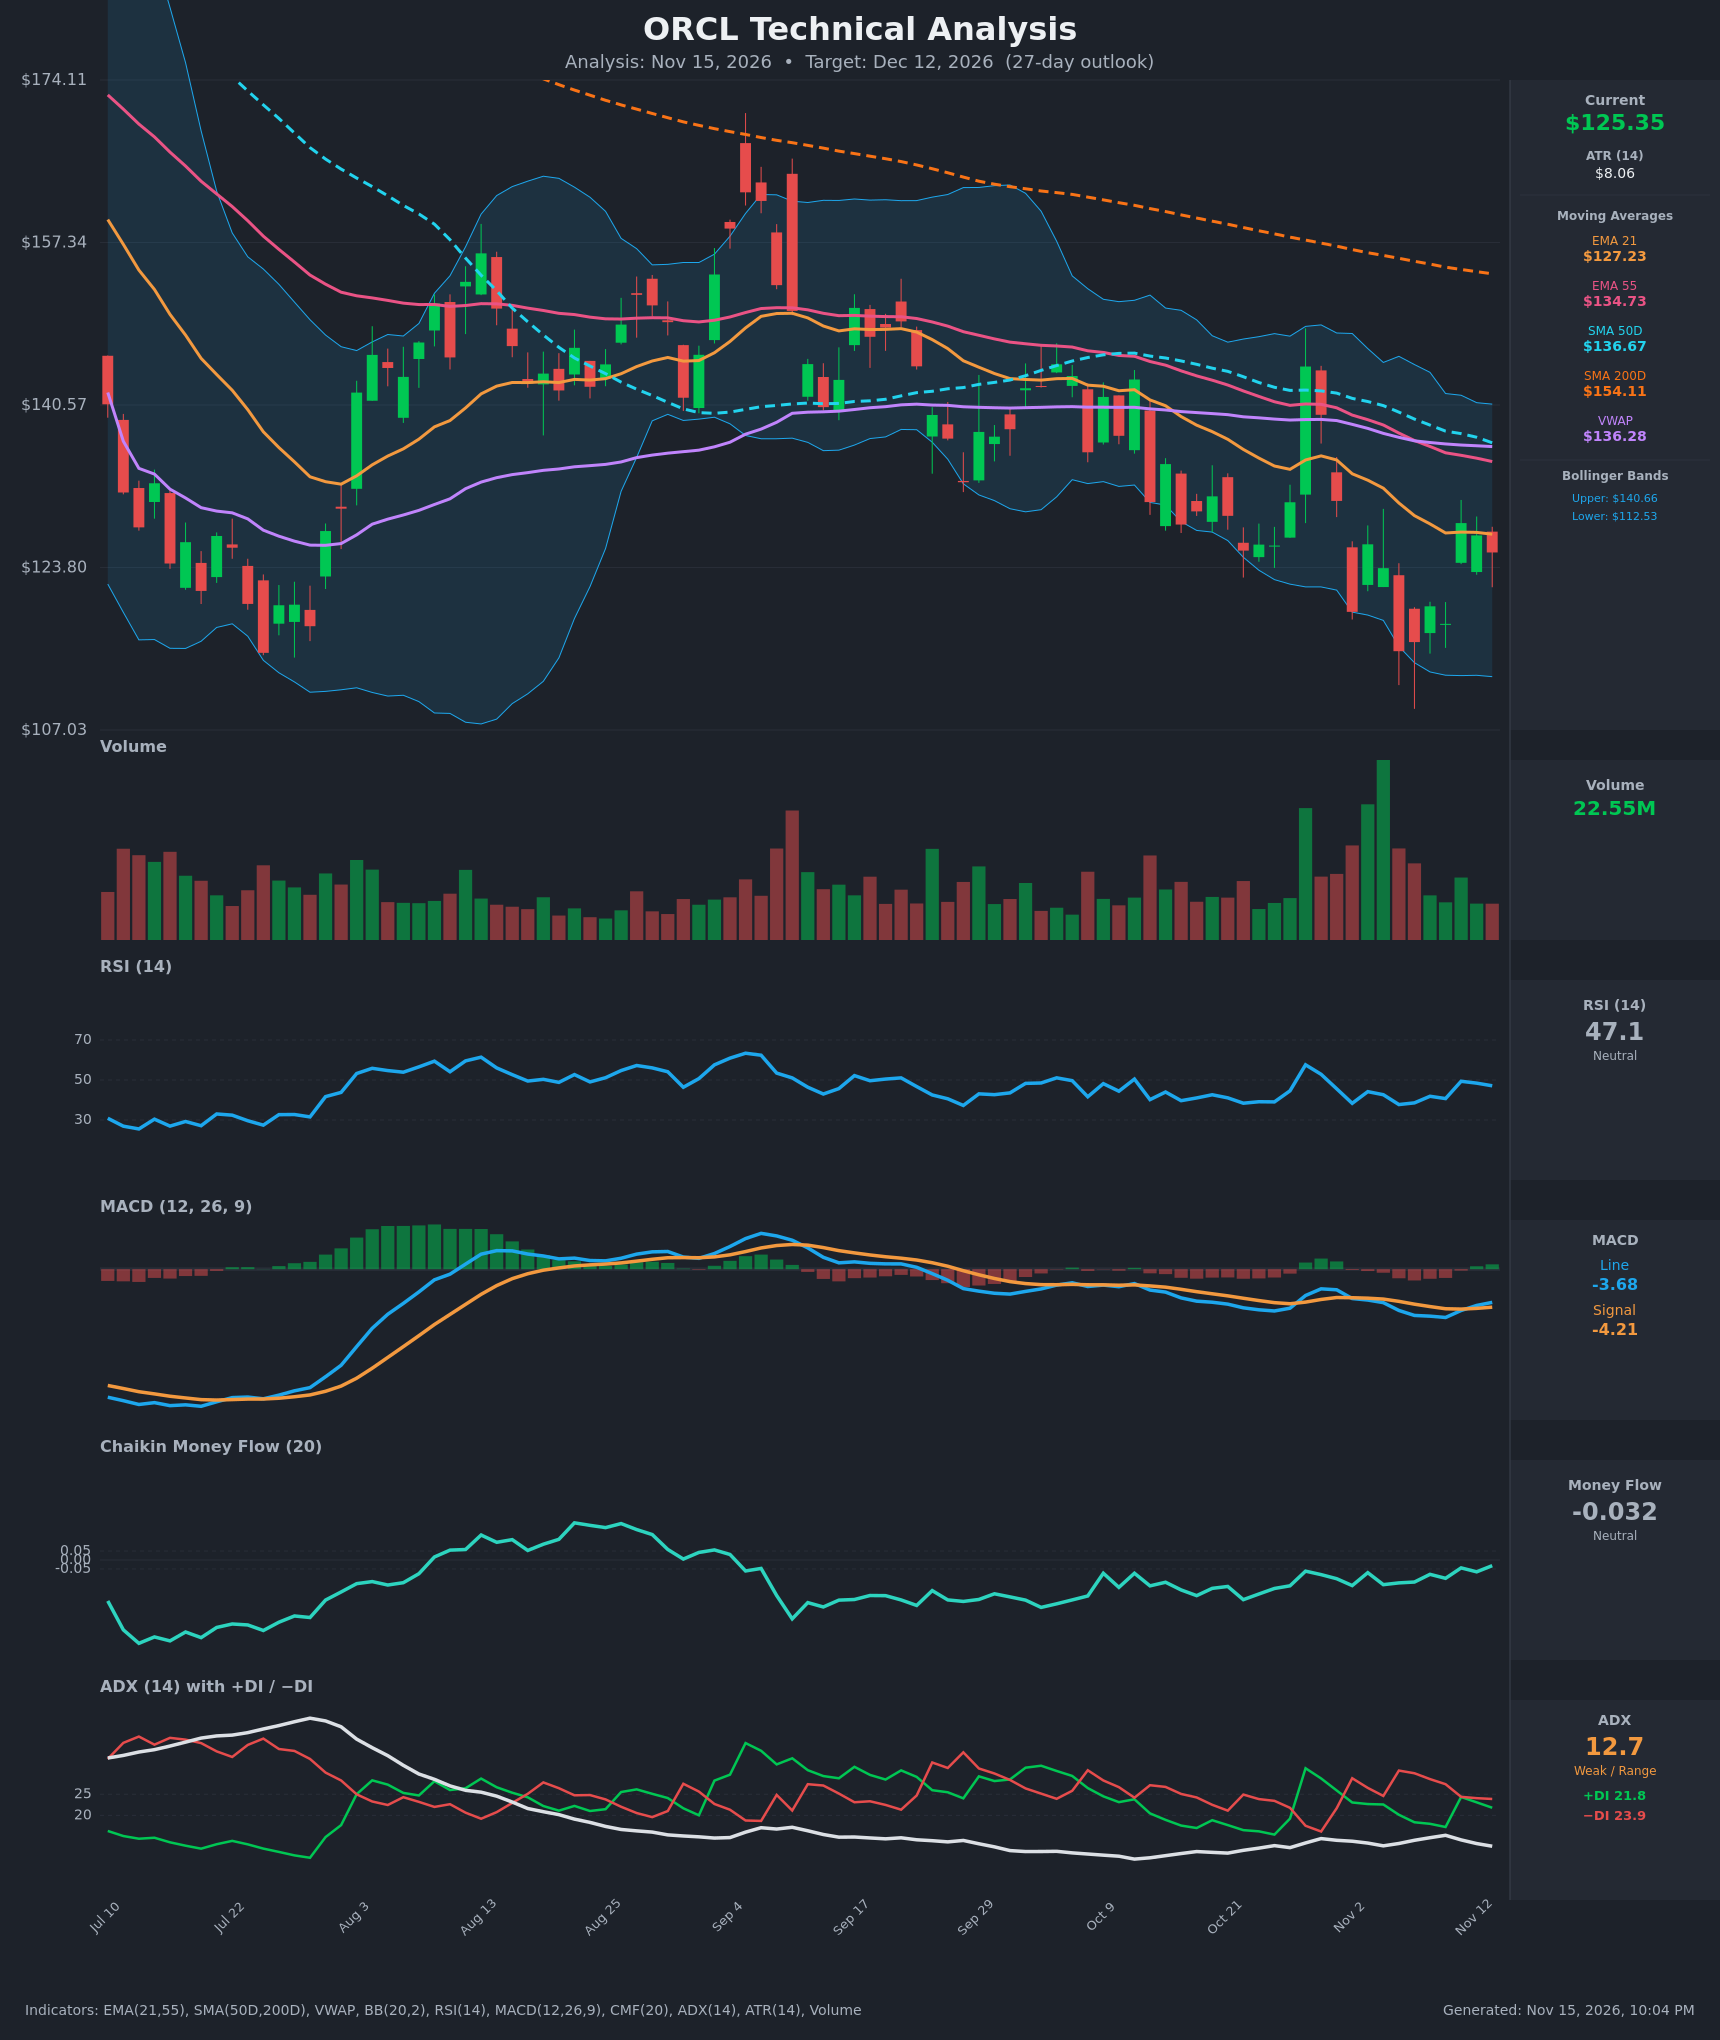
- RSI (14): 47.11, mid-range and neutral. It has recovered from 37.7 on Nov 5 but remains below 50 and has not shown a clear momentum break either way. [Neutral]
- 20 EMA: The 21 EMA is $127.23 and price ($125.35) sits just below it, so it acts as near-term resistance. EMA21 is also well below EMA55 ($134.73), which keeps the bearish stack intact. [Bearish]
- MACD: The line (-3.68) has just crossed above the signal (-4.21), and the histogram is slightly positive. Both lines are still well below zero, so this is a weak early bounce signal inside a downtrend. [Neutral]
- Bollinger Bands (20): Upper is $140.66 and lower is $112.53, with a midline near $126.60. Price is hugging the midline after bouncing from the lower band. The bands have started to narrow from the wide Oct–Nov swings, which suggests the volatility spike is fading. [Neutral]
- CMF (20): -0.032, inside the ±0.05 neutral band. It has improved from -0.159 on Oct 26 but never turned into accumulation. [Neutral]
- ADX (14): 12.7 and falling, so the trend is weak or range-bound. −DI (23.9) is only slightly above +DI (21.8), so bears hold a marginal edge. [Weak Trend, slight bearish tilt]
- Volume: The latest bar is 22.55M, modest compared with the heavy-volume selloff and spike bars in late Oct and early Nov. Fading volume on the recent bounce shows little conviction from buyers. [Neutral to slightly bearish]
DIVERGENCES & TRENDS
- Moving averages: Price is below EMA21, EMA55, SMA50D ($136.67), SMA200D ($154.11) and VWAP ($136.28). The SMA50D/SMA200D death cross has already occurred, and the SMA200D is still sloping down. This is a clear long-term downtrend.
- Price structure: Lower highs have formed from ~$170 in early Sep to ~$150, ~$145 and now ~$130. The Oct 28 spike to $144.54 was fully reversed within three sessions.
- Momentum: The MACD crossover and the RSI rising from 37.7 are mild positive changes. There is no clear price/RSI divergence, because price made lows near $115 while RSI only dipped to ~38.
- Trend strength: ADX at 12.7 and declining shows the downtrend has lost force, so a choppy range is likely. Directional bias comes mainly from the MA structure.
CHART PATTERNS
- Descending Triangle (continuation, bearish): Lower highs press against a roughly flat support zone near $115–$118. A decisive close below $115 would project a measured move toward about $105–$108.
- Bullish Double Bottom (reversal, possible): Lows near $115.16 (Nov 5) and ~$116–$118 (Nov 6–10) could form a double bottom. It needs a close above the ~$130 neckline, which is also near the EMA55 and VWAP overhead, and that has not happened. The pattern is incomplete, so I rank it as the lower-probability outcome.
- Overall: The pattern evidence is mixed, but the dominant structure remains a downtrend that consolidates beneath falling resistance.
POTENTIAL SCENARIOS
- Scenario 1: Bearish Rejection and Retest of Lows — Price fails at the EMA21 and the ~$130 area, then slides back to retest the $115–$117 support. The downtrend structure (below all MAs, death cross, −DI > +DI) argues for this drift. Trigger: rejection at $127–$130 and a close below $120. Target: $115, with an extension toward $112.50 (lower BB). Invalidation: a daily close above $131. (45% probability)
- Scenario 2: Neutral Range Chop — Low ADX and neutral CMF/RSI keep price oscillating between $115 and $130, which matches the last two weeks. Trigger: failed breaks of both $115 and $130. Target: $120–$128. Invalidation: a close beyond either boundary. (30% probability)
- Scenario 3: Bullish Relief Rally — The MACD cross and a possible double bottom lead to a squeeze above the EMA21, targeting the EMA55/VWAP/SMA50D cluster. Trigger: a close above $130 on rising volume. Target: $135–$137. Invalidation: a close below $115. (25% probability)
PRICE TARGETS
- Target Price: $121.00 (27-day horizon, Dec 12, 2026)
- Expected Range: $111.00 to $130.00 (width $19.00, about 15.2% of current price, within the 12–18% guide for 30–60 days scaled to 27 days)
- Key Levels: Support at $115.00 (Nov 5 low close, above the $112.53 lower BB); Resistance at $127.23 (EMA21), then $134.73 (EMA55)
OVERALL BIAS
OVERALL BIAS: BEARISH - Price sits below every major moving average and VWAP after a death cross, with lower highs and −DI above +DI. The fresh MACD cross and neutral RSI/CMF look like a weak bounce inside the downtrend, so a drift toward the $115 support zone is more likely than a sustained recovery.
This is educational analysis and not financial advice.