ORCL 34-day bearish forecast — Nov 15, 2026
- Bias: Bearish
- Timeframe: 34 days (made Nov 15, 2026, target date Dec 18, 2026)
- Price at analysis: $125.35
- Price target: $120.50
- Expected range: $111.00 – $130.00
- Result: Pending — graded after the close on Dec 18, 2026
Get a free AI analysis of ORCL today
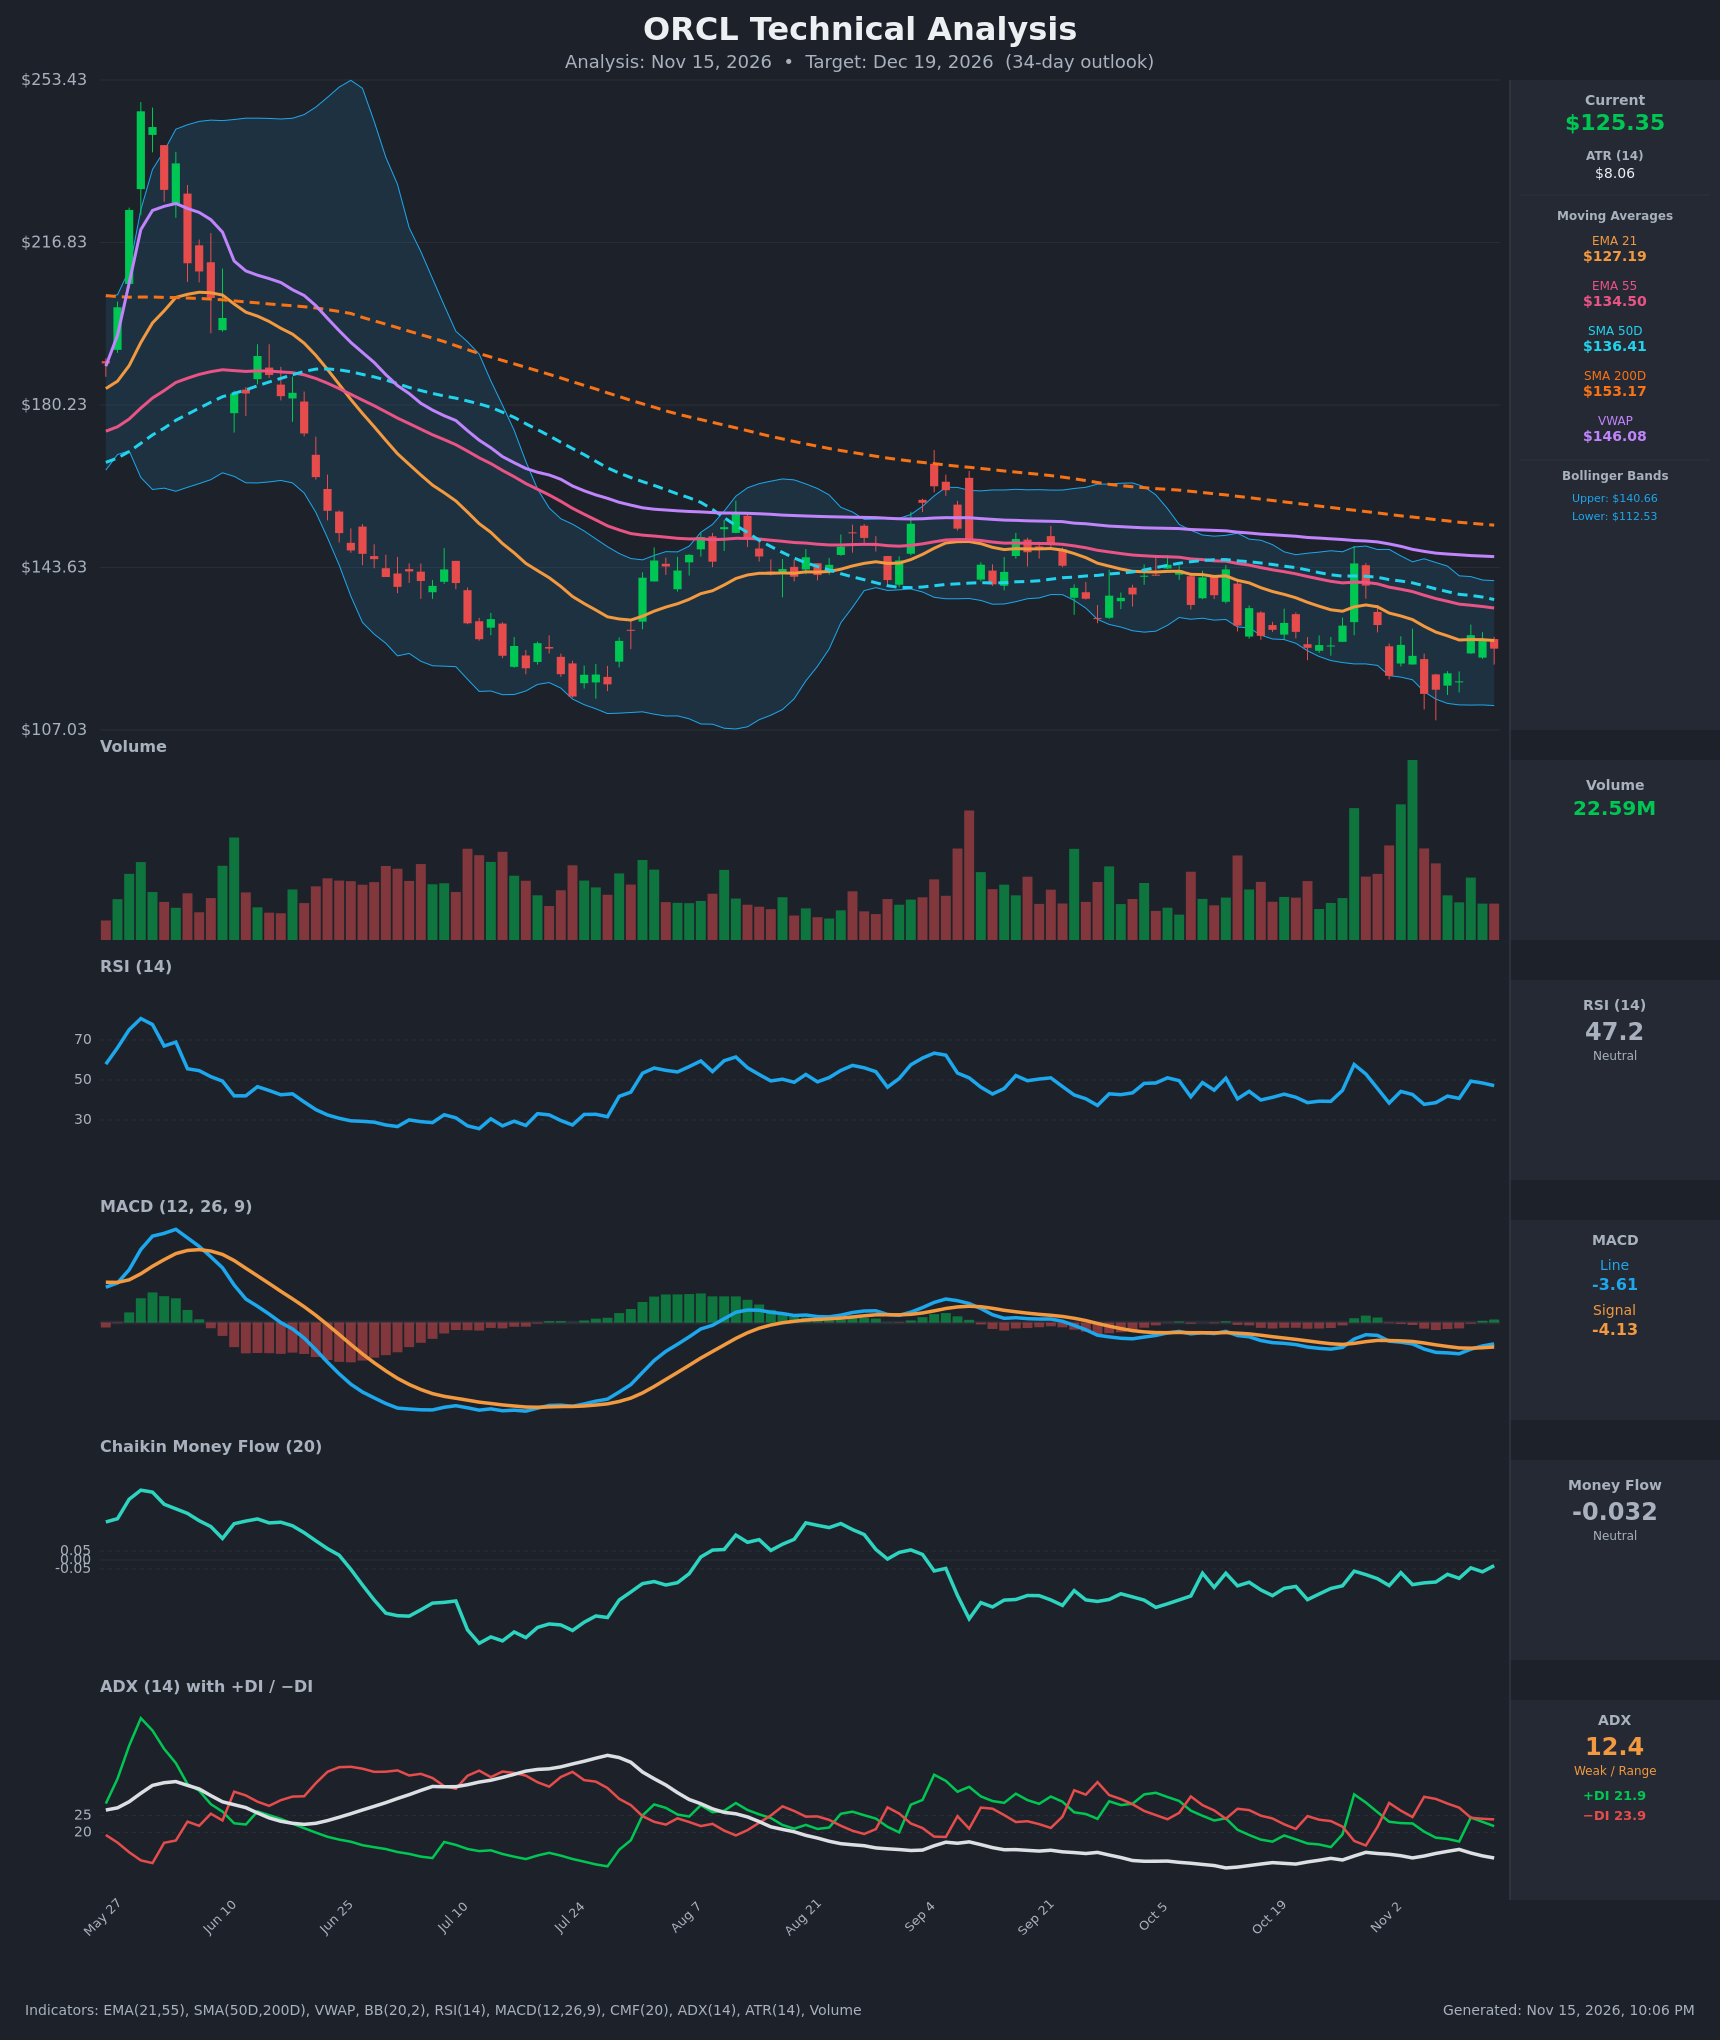
Analysis
TECHNICAL INDICATORS
- RSI (14): 47.17, just under the 50 midline after bouncing from 37.8 on Nov 5. It has recovered from the low 40s, but it keeps failing at 50 to 57 on rallies. Momentum is neutral and slightly soft. [Neutral]
- 20 EMA (21 EMA): $127.19. Price at $125.35 is below it, and the EMA is still sloping down (it was $134.10 on Oct 26). Price has been oscillating around it for several sessions, so it acts as near-term resistance. EMA21 is also below EMA55 ($134.50), which confirms a bearish short-term trend structure. [Bearish]
- MACD: Line -3.615 is above signal -4.128, a modest bullish crossover on Nov 11 with a small positive histogram of about +0.51. Both lines are still well below zero, so this looks like a relief bounce within a downtrend, not a trend change. [Neutral]
- Bollinger Bands (20): Upper $140.66, lower $112.53, midline about $126.60. Price sits right at the midline. The bands have been contracting from the Oct highs, and the lower band keeps stepping down with price. There is no squeeze breakout yet. [Neutral]
- CMF (20): -0.032, inside the ±0.05 neutral zone. It has improved from -0.159 on Oct 26, so selling pressure is easing, but there is no real accumulation yet. [Neutral]
- ADX (14): 12.4 with −DI 23.9 slightly above +DI 21.9. ADX is very weak (<20), so there is no established trend. The slight −DI edge, after +DI briefly led on Oct 28–29, tilts mildly bearish. [Weak Trend, slight bearish tilt]
- Volume: 22.59M, fading after the huge spike in late Oct and early Nov. That spike coincided with violent two-way swings (+$14, then -$25 over a few sessions) rather than a clean directional move. Current volume is average, with no conviction either way. [Neutral, fading participation]
Other trend context:
- SMA 50D: $136.41, above price and sloping down.
- SMA 200D: $153.17, far above price, and SMA50 is below SMA200. The death cross has already occurred, so the long-term trend is down.
- VWAP: $146.08, about 14% above price, which shows sellers have been in control on a volume-weighted basis.
DIVERGENCES & TRENDS
- No clear divergence: price made a lower low at about $115 on Nov 5, and RSI made a similar low (37.8), versus 38.5 on Nov 2 at a higher price. That is only a marginal mild bullish divergence, not a reliable signal.
- MACD vs. price: MACD crossed above its signal while still deeply negative. This is a weak momentum bounce, and similar crosses in Sep and Oct failed beneath the MAs.
- CMF trend: a steady recovery from deeply negative toward zero since July, but it has not crossed above +0.05. It is a constructive sign that selling is drying up.
- Moving averages: every MA (EMA21, EMA55, SMA50, SMA200, VWAP) is stacked above price in descending order, a classic bearish alignment. The SMA200 has fallen steadily from about $157 to $153.
- Price structure: lower highs (about $170 in Sep, about $145 in Oct, about $128 in Nov) and lower lows (about $112 to $115) define a persistent downtrend channel.
- ADX: it has declined from about 25 in early July to 12.4, so the drift lower is slow and choppy rather than a strong trend. That favors grinding, whipsaw action.
CHART PATTERNS
- Descending channel / Bearish Flag-type continuation: the best fit from the reference diagram. After the big drop from $253 to the $115 to $130 area, price is making lower highs and lower lows in a gentle downward slope. The measured implication is a continuation toward the low $110s, and a break below about $112 to $115 would target roughly $100 to $105.
- Possible Bullish Falling Wedge: the contracting Bollinger Bands and the narrowing lows suggest a falling wedge could be forming. It would need a decisive close above the EMA55 and SMA50 near $134 to $136 to confirm, and that has not happened. It remains a lower-probability alternative.
- Range context: the $112 to $115 lows have held twice. Reaching them again would make a Double Bottom-type base possible, but it is unconfirmed.
POTENTIAL SCENARIOS
- Scenario 1: Bearish Grind Lower Within Downtrend — Price remains capped by the declining EMA21/EMA55 and keeps making lower highs. Sellers push it back to retest the $112–$115 zone, with a possible overshoot below. Trigger: rejection at $127–$129 and a daily close below $120. Target: $115 first, then $111–$112. Invalidation: a daily close above $134.50 (EMA55) with MACD rising toward zero. (50% probability)
- Scenario 2: Bullish Relief Rally — The MACD cross, rising CMF, and recovering RSI lead to a mean-reversion bounce toward the upper Bollinger Band. Trigger: a close above $129 on rising volume, then reclaiming $134.50. Target: $134–$138 (EMA55/SMA50), with an extension toward $140.66. Invalidation: a close back below $120 or a loss of the $115 support. (30% probability)
- Scenario 3: Neutral Choppy Consolidation — With ADX at 12, price oscillates between about $115 and $130 and ends near the current level. Trigger: failure to close beyond either $129 or $118. Target: $120–$128. Invalidation: a decisive close outside the $112–$134 range. (20% probability)
PRICE TARGETS
34-day horizon (ATR of $8.06 implies a typical 34-day standard move well above $20, so the range is set to about 15% of price).
- Target Price: $120.50
- Expected Range: $111.00 to $130.00 (width $19.00, about 15.2% of current price, consistent with the 30–60 day guidance)
- Key Levels: Support at $115.16 (Nov 5 closing low; intraday lows near $112 sit just beneath), Resistance at $127.19 (EMA21), with the next resistance at $134.50 (EMA55)
OVERALL BIAS
OVERALL BIAS: BEARISH - Price is below every major moving average and VWAP, the death cross is in place, and the series of lower highs and lower lows persists with −DI above +DI. The MACD cross and improving CMF are only a modest offset in a weak-ADX environment, so conviction is moderate and the target is a drift toward the $115 support zone.
This is educational analysis and not financial advice.