ORCL 83-day bearish forecast — Nov 15, 2026
- Bias: Bearish
- Timeframe: 83 days (made Nov 15, 2026, target date Feb 5, 2027)
- Price at analysis: $125.35
- Price target: $119.00
- Expected range: $104.00 – $134.00
- Result: Pending — graded after the close on Feb 5, 2027
Get a free AI analysis of ORCL today
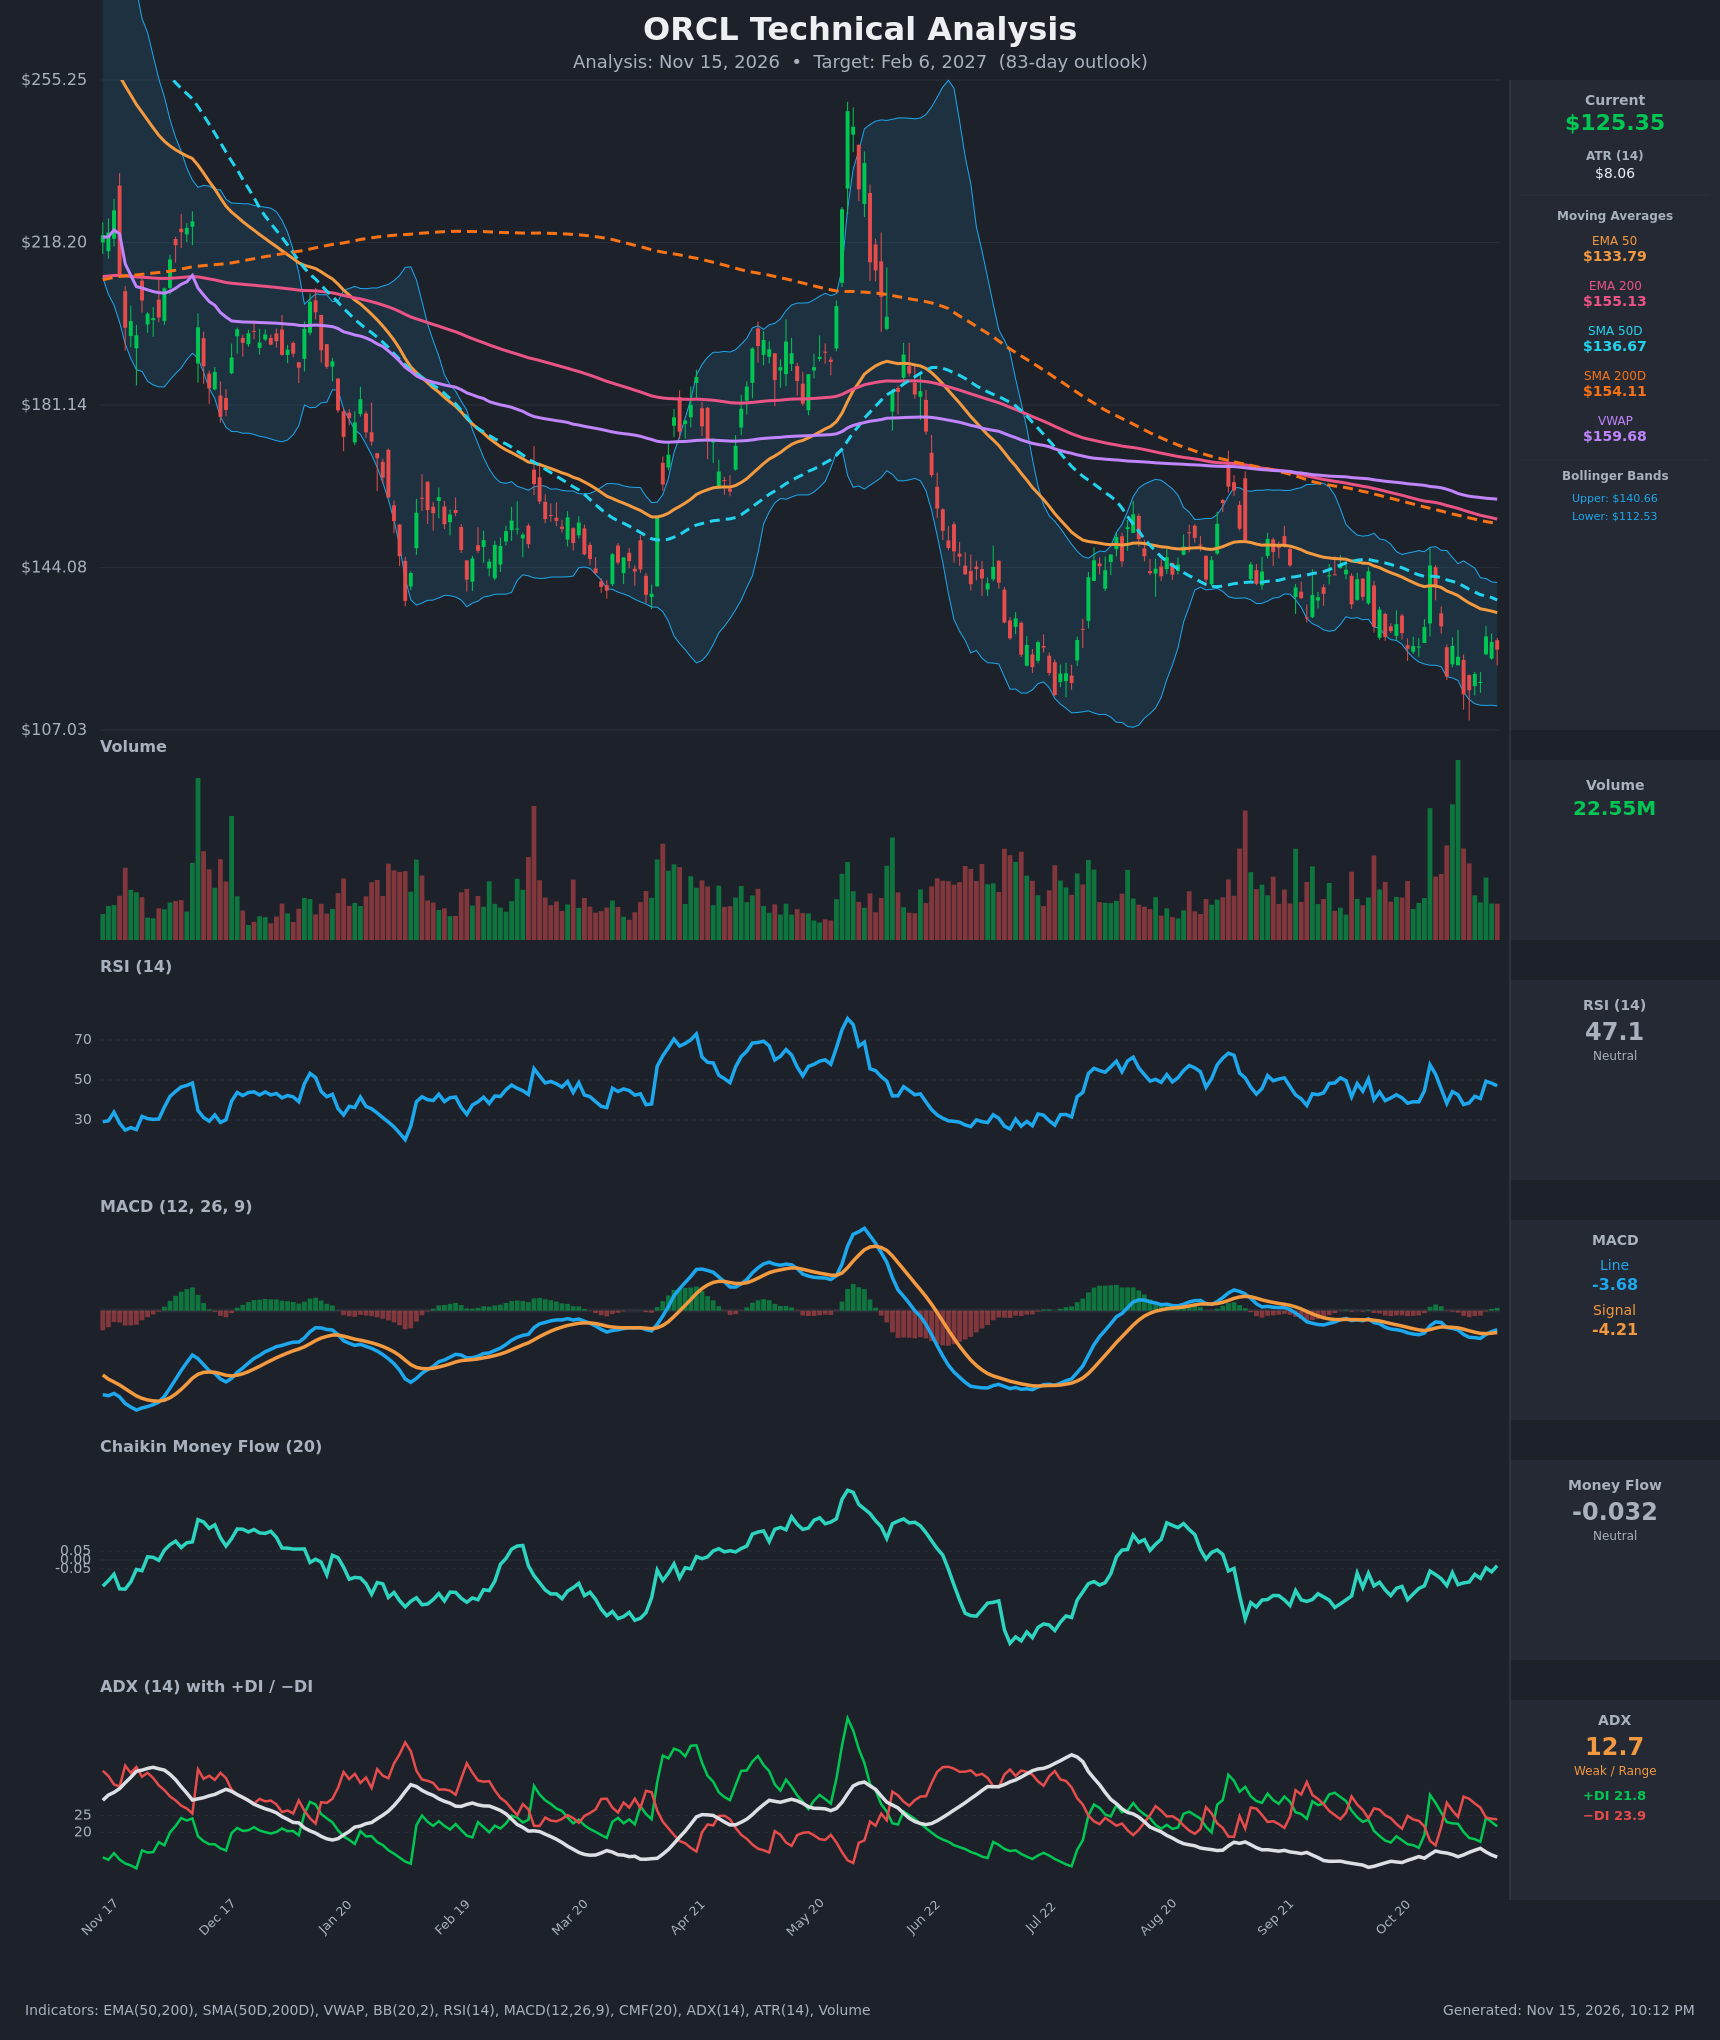
Analysis
TECHNICAL INDICATORS
- RSI (14): 47.11, just under the 50 midline. It is recovering from 37.7 on Nov 5 but has faded from 49.4 on Nov 11. It shows no oversold or overbought condition, and momentum is flat. [Neutral]
- 20 EMA: Not supplied. Price at $125.35 is well below the EMA 50 ($133.79), which is falling and acts as resistance. A 20 EMA would sit near the BB midline (~$126.6), so price is hovering just under it. [Bearish]
- MACD: Line -3.68 is above signal -4.21, a small bullish crossover on Nov 12-13. Both lines are deeply negative and below zero, so this is a shallow relief signal inside a bearish structure. The histogram has just turned slightly positive. [Neutral]
- Bollinger Bands (20): Upper $140.66, lower $112.53, midline ~$126.6. Price is at the midline, after bouncing from the lower band area (~$115) on Nov 5-10. The bands are narrower than in the summer, and the downward slope of the bands and midline confirms the downtrend. [Neutral]
- CMF (20): -0.032, inside the ±0.05 neutral zone. It has improved from -0.159 on Oct 26, so selling pressure is easing, but it has not turned into accumulation. [Neutral]
- ADX (14): 12.7 and falling, so the trend is very weak and range-like. −DI (23.9) is above +DI (21.8), a marginal bearish edge. The DIs were equal on Nov 11 and bears have since regained a slight lead. [Weak Trend, slight bearish tilt]
- Volume: 22.55M, near average. The recent high-volume spikes (late Oct) were on a sharp up-bar and a sharp reversal, which shows volatile two-way trading, not clear accumulation. Down days have not been on capitulation volume. [Neutral]
Moving-average structure is clearly bearish:
- Price is below the EMA50 ($133.79), SMA50D ($136.67), EMA200 ($155.13), SMA200D ($154.11) and VWAP ($159.68).
- EMA50 is below EMA200, and SMA50D is below SMA200D (a death cross is in place).
- All of these are still declining.
DIVERGENCES & TRENDS
- Price vs. RSI: Price made a lower low (~$115) while RSI held around 37-38, near its prior lows, so there is no strong divergence. RSI has not gone below 30 since the summer, which shows weaker downside momentum than the earlier May-July selloff, though not a confirmed bullish divergence.
- MACD: The bullish line/signal crossover is early and occurs below zero. Such crossovers in downtrends often fail near the falling EMA50.
- CMF: Recovering from -0.16 toward neutral, which is a mild improvement.
- ADX/DI: ADX has dropped from the mid-20s to 12.7, so trend strength is fading. This points to consolidation in the lower part of a long-term downtrend. Bears are still marginally ahead.
- Trend: Lower highs since May (~$250, then ~$170, ~$160, ~$145) and lower lows, with price below a falling 200-day average. The long-term trend is down.
- Crossovers: The death cross (SMA50D below SMA200D) and EMA50 below EMA200 are established. The only recent bullish crossover is MACD.
CHART PATTERNS
- Descending Triangle (primary, bearish continuation): Lower highs (~$160 in Aug, ~$145 in Oct) press against a horizontal support zone of ~$115-118 (July lows, Nov 5 and Nov 10 closes). A decisive close below ~$115 would project a measured move toward ~$100-105, in line with the pattern's height.
- Triple Bottom / Double Bottom (alternative, bullish): The $115-118 zone has been tested three times. A reversal here would need a break above ~$128-134 and the EMA50, and confirmation is still missing.
- Bearish flag character: The Oct-Nov bounce and consolidation under the falling EMA50 resembles a weak counter-trend rally within the downtrend.
- Net, the structure leans toward a bearish continuation but is not decisive because ADX is low.
POTENTIAL SCENARIOS
- Scenario 1: Bearish Support Break / Descending Triangle Resolution — Rallies fail below the falling EMA50 (~$133) and price breaks the repeatedly tested $115-117 support, with the death-cross structure and −DI dominance continuing. Trigger: daily close below $115 (lower BB ~$112.5 is already in play). Target: $103-108, with an extension to ~$100. Invalidation: daily close above $134 (EMA50) with rising volume. (45% probability)
- Scenario 2: Bullish Triple-Bottom Relief Rally — The $115 support holds a third time, the MACD cross extends and CMF turns positive. Price rallies toward the upper BB and the SMA50D. Trigger: close above $134 with CMF above +0.05. Target: $140-145 (upper BB / Oct high), with a stretch to ~$155 (200-day averages). Invalidation: close below $115. (30% probability)
- Scenario 3: Neutral Range Consolidation — With ADX near 12, price oscillates between ~$115 support and ~$134-140 resistance without resolving. Trigger: failure of either a break below $115 or a break above $134. Target: $120-130. Invalidation: a decisive close outside the $112-141 band area. (25% probability)
PRICE TARGETS
For the 83-day horizon (through ~Feb 6, 2027), the expected range uses ~24% width: $104.00 to $134.00 = $30.00 width, or 23.9% of $125.35, which fits the 18-30% guidance for 61-180 days.
- Target Price: $119.00 (a slightly bearish drift from $125.35, consistent with the downtrend, the break risk at $115 and a likely rejection at the EMA50)
- Expected Range: $104.00 to $134.00
- Key Levels: Support at $115.00, Resistance at $133.79
OVERALL BIAS
OVERALL BIAS: BEARISH - Price sits below every major moving average with a death cross in place, −DI is above +DI, and lower highs press against the $115-118 support. The MACD cross and neutral CMF/RSI limit conviction, but the bearish scenario carries the most probability.
This is educational analysis and not financial advice.