ORCL 62-day bearish forecast — Nov 15, 2026
- Bias: Bearish
- Timeframe: 62 days (made Nov 15, 2026, target date Jan 15, 2027)
- Price at analysis: $125.35
- Price target: $119.50
- Expected range: $106.00 – $134.00
- Result: Pending — graded after the close on Jan 15, 2027
Get a free AI analysis of ORCL today
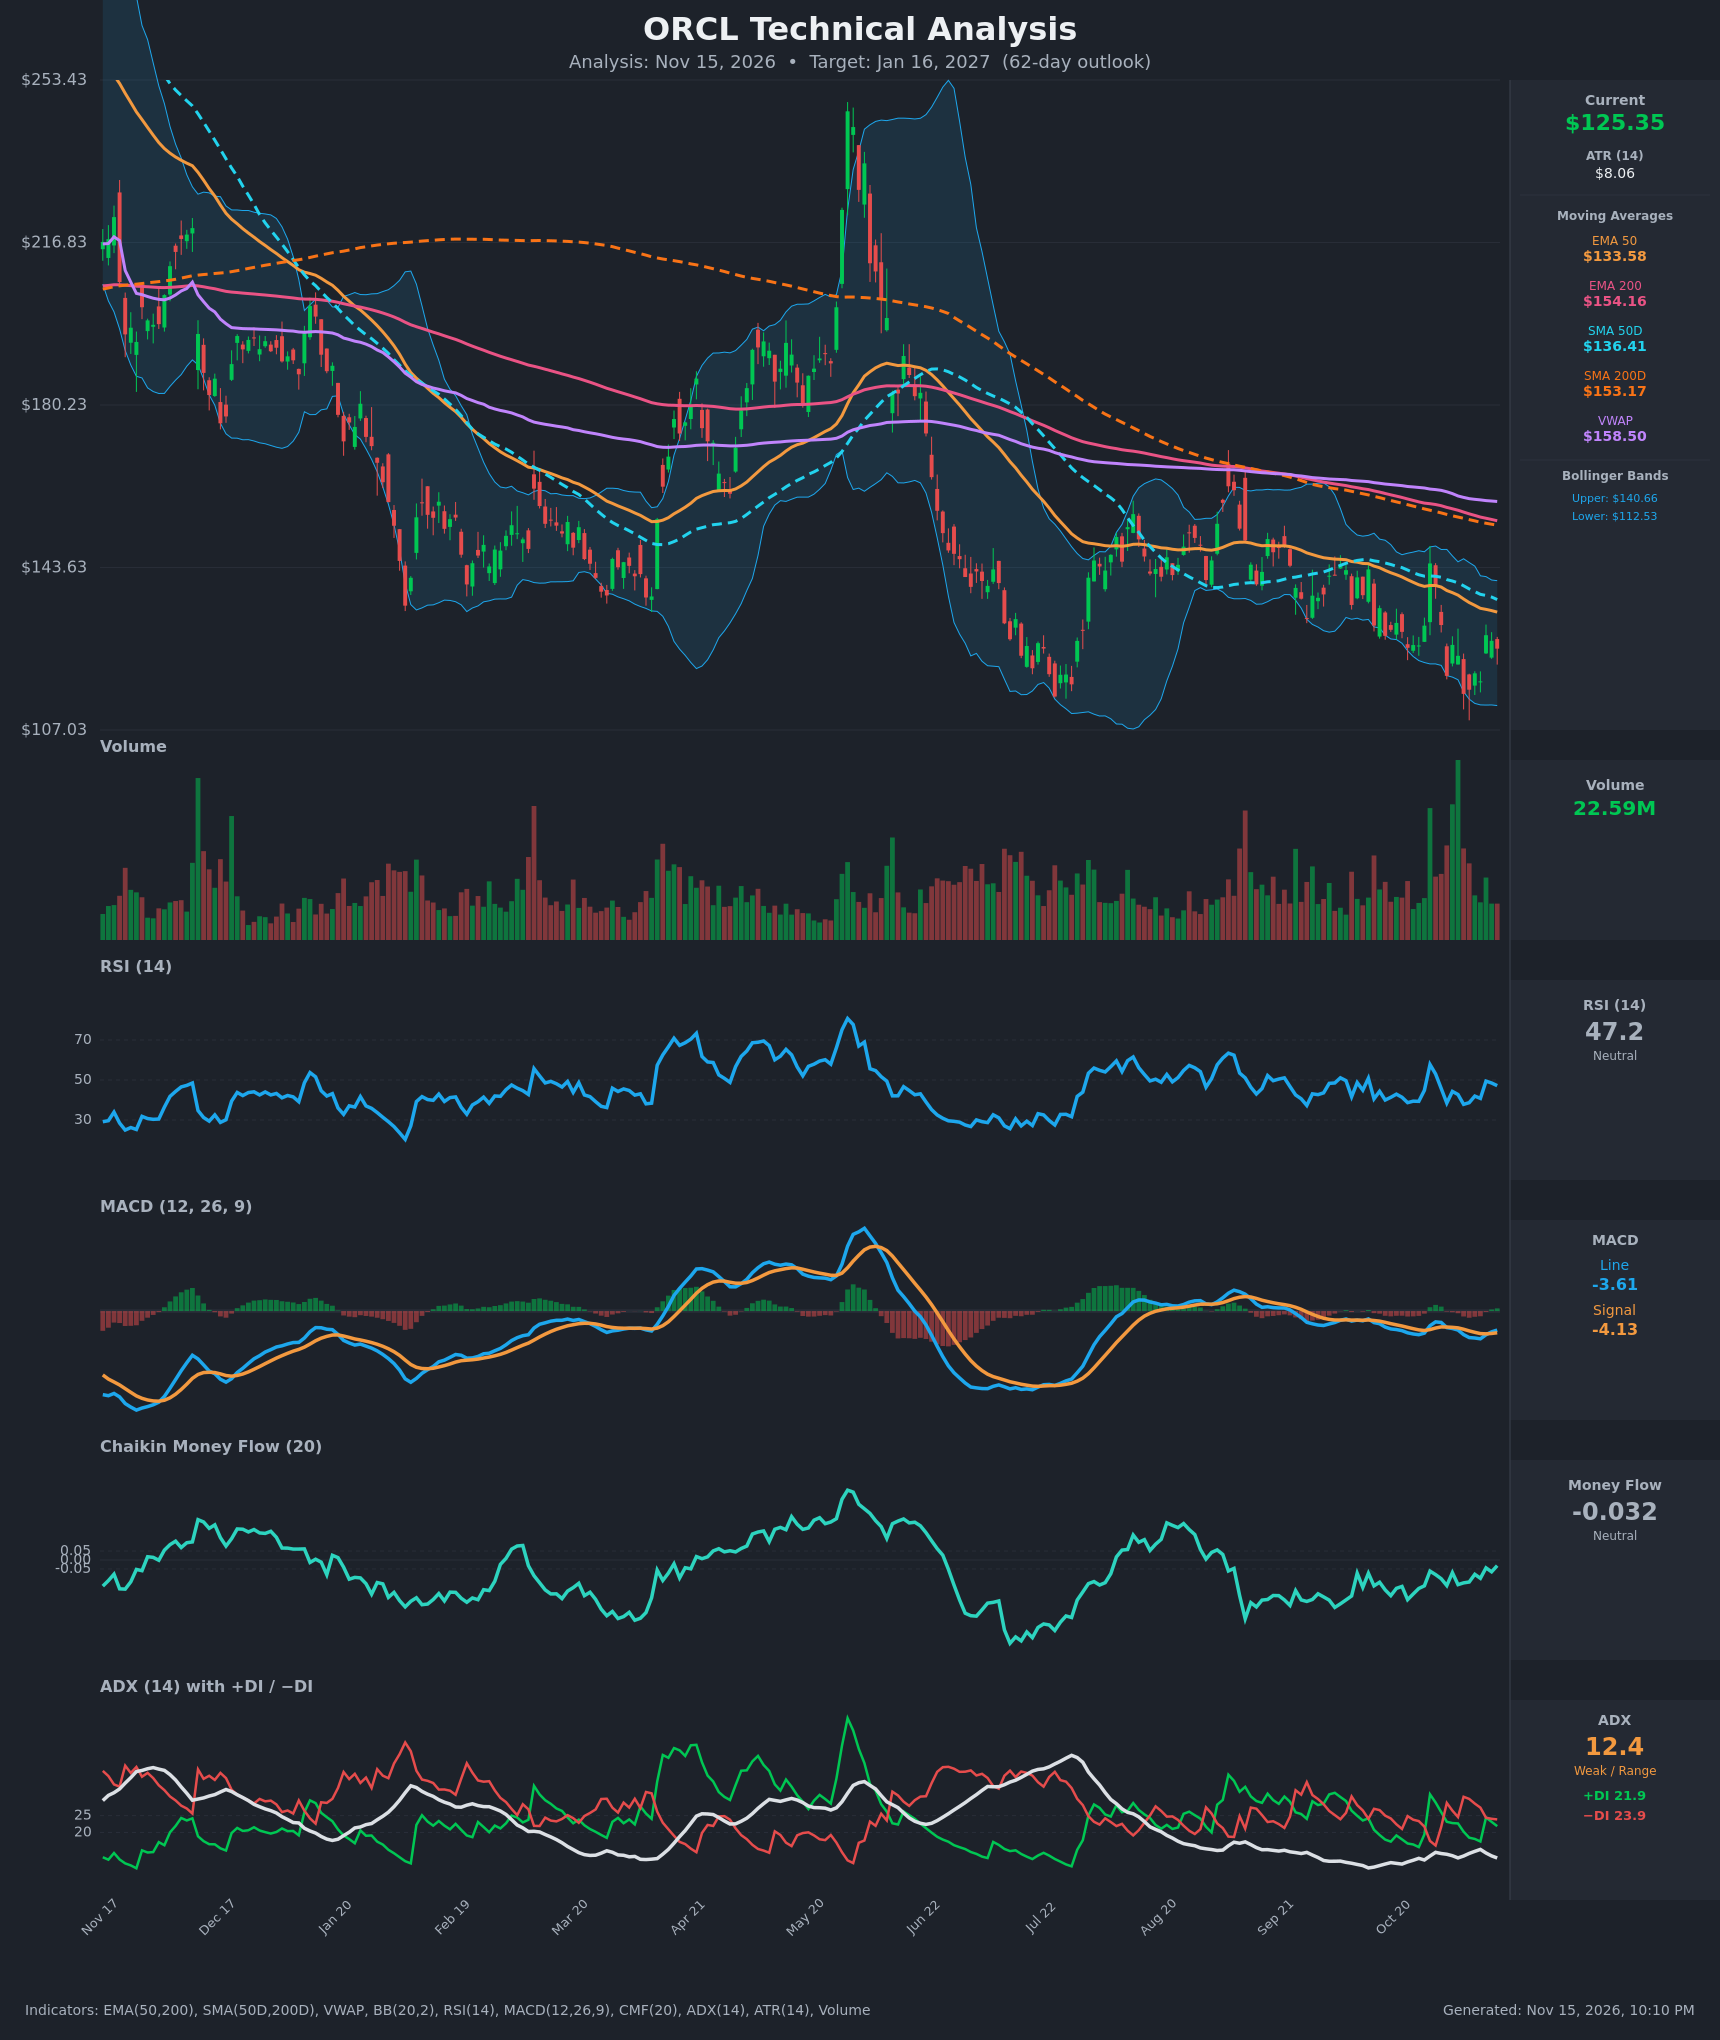
Analysis
TECHNICAL INDICATORS
- RSI (14): 47.17, neutral and mid-range. It has bounced from the 38 area on Nov 5-6 but is rolling over from 49.4 on Nov 11. Over the past year it has failed to hold above 60 since the May peak. [Neutral]
- 20 EMA: The 20 EMA is not provided. The supplied EMA 50 is $133.58, with price ($125.35) about 6% below it, and it has been falling every session (139.74 → 133.58). EMA 50 is well below EMA 200 ($154.16), a bearish structure, and the EMA 50 area is the first resistance. [Bearish]
- MACD: Line -3.615 is above signal -4.128, a fresh bullish crossover on Nov 11-12 with a small positive histogram (+0.51). Both lines are still deep below zero, so this is a weak relief signal inside a downtrend. [Neutral]
- Bollinger Bands (20): Upper $140.66, lower $112.53, midline about $126.60. Price sits right at the midline after hugging the lower band through late October and early November. The bands have been trending lower, and a "walk down the lower band" pattern is visible. [Neutral]
- CMF (20): -0.032, inside the neutral band (±0.05) and improving from -0.159 on Oct 26. Money flow has been negative to flat for months, so there is no real accumulation. [Neutral]
- ADX (14): 12.4, which is weak/range-bound and has been falling since July. -DI (23.9) is slightly above +DI (21.9), so bears have a marginal edge but there is no trend strength. [Weak Trend, slight bearish tilt]
- Volume: 22.59M, average to below average on the latest bar. The volume spikes in late October and early November came on both up and down days (e.g. the Oct 28 spike to $144.54 was fully reversed). Rallies are being sold into, which suggests distribution. [Mildly Bearish]
- Long-term averages: Price is below SMA 200 ($153.17), SMA 50 ($136.41), EMA 200 and VWAP ($158.50). SMA 50 is below SMA 200, a death cross that has persisted for months. [Bearish]
DIVERGENCES & TRENDS
- Price made a marginally lower low in early November ($115.16) than the Jul-Aug area low (~$115), while RSI (about 38) stayed well above its July low (~27). This is a mild bullish RSI divergence and the main argument for a base.
- The MACD bullish crossover is below the zero line. Historically in this chart, sub-zero crossovers have produced only short bounces (e.g. the Aug-Sep rally faded at the SMA 200).
- ADX at 12 shows trend exhaustion, not a reversal. A decline this long with ADX this low often precedes a choppy base, but nothing confirms a turn yet.
- Price keeps making lower highs: ~$165 (Aug), ~$148, ~$144.5 (Oct 28, rejected immediately). The sequence of lower highs and the MAs stacked above price (EMA 50 → SMA 50 → SMA 200 → EMA 200 → VWAP) keep the primary trend down.
- The +DI/−DI lines are interwoven around 22-24. The bulls' attempt on Oct 28 (+DI 31) failed within two sessions.
CHART PATTERNS
- Bullish Double Bottom (reversal, potential): Lows near $115 (Jul and Nov 5) with a neckline well above, around $144-148 (the Oct 28 spike high and the Sep-Oct consolidation). It is unconfirmed, because price is mid-pattern. A confirmed break above $145 would target roughly $175.
- Descending channel / lower-highs structure (continuation): The multi-month series of lower highs and lower lows resembles a bearish continuation. A close below $115 would project toward about $100-105 (measured from recent range depth).
- Current range: The last 4 months of price are roughly $115-$148, with weak ADX. This is a loose consolidation within a downtrend, not a clean neutral structure.
POTENTIAL SCENARIOS
- Scenario 1: Bearish Downtrend Resumption — Price fails at the EMA 50/midline zone ($126-134) and rolls back toward the lower Bollinger Band as the death-cross structure and distribution volume persist. Trigger: rejection at $133-134 or a close below $120 with -DI crossing back above +DI. Target: $112-$115 first, then $105 on a break. Invalidation: daily close above $141 (upper band / SMA 50). (45% probability)
- Scenario 2: Bullish Double-Bottom Relief Rally — The MACD crossover and RSI divergence lead to a base above $115 and a bounce toward the moving-average cluster. Trigger: close above $134 (EMA 50) on rising volume with CMF above +0.05. Target: $141-$148, with an extension to the SMA 200 near $153. Invalidation: close below $115. (35% probability)
- Scenario 3: Neutral Range Chop — ADX stays below 20 and price oscillates between $115 and $140 without resolution. Trigger: no break of $115 or $141. Target: $120-$132. Invalidation: a decisive close outside $112-$142. (20% probability)
PRICE TARGETS
- Target Price: $119.50 (62-day, Jan 16, 2027)
- Expected Range: $106.00 to $134.00 (width $28.00, about 22.3% of current price, consistent with the 18-30% guidance for 61-180 days)
- Key Levels: Support at $115.00 (double-bottom lows, just above the $112.53 lower band), Resistance at $133.58 (EMA 50, with SMA 50 at $136.41 behind it)
OVERALL BIAS
OVERALL BIAS: BEARISH - Price is below every major moving average with a persistent death cross, a falling EMA 50 and a series of lower highs. Rallies such as Oct 28 have been sold into, and -DI is above +DI. Conviction is modest because ADX is only 12.4, MACD has just crossed up, and a possible double bottom near $115 could produce a relief bounce.
This is educational analysis and not financial advice.