ORCL 20-day bearish forecast — Nov 15, 2026
- Bias: Bearish
- Timeframe: 20 days (made Nov 15, 2026, target date Dec 4, 2026)
- Price at analysis: $125.35
- Price target: $121.50
- Expected range: $111.00 – $131.50
- Result: Pending — graded after the close on Dec 4, 2026
Get a free AI analysis of ORCL today
Analysis
TECHNICAL INDICATORS
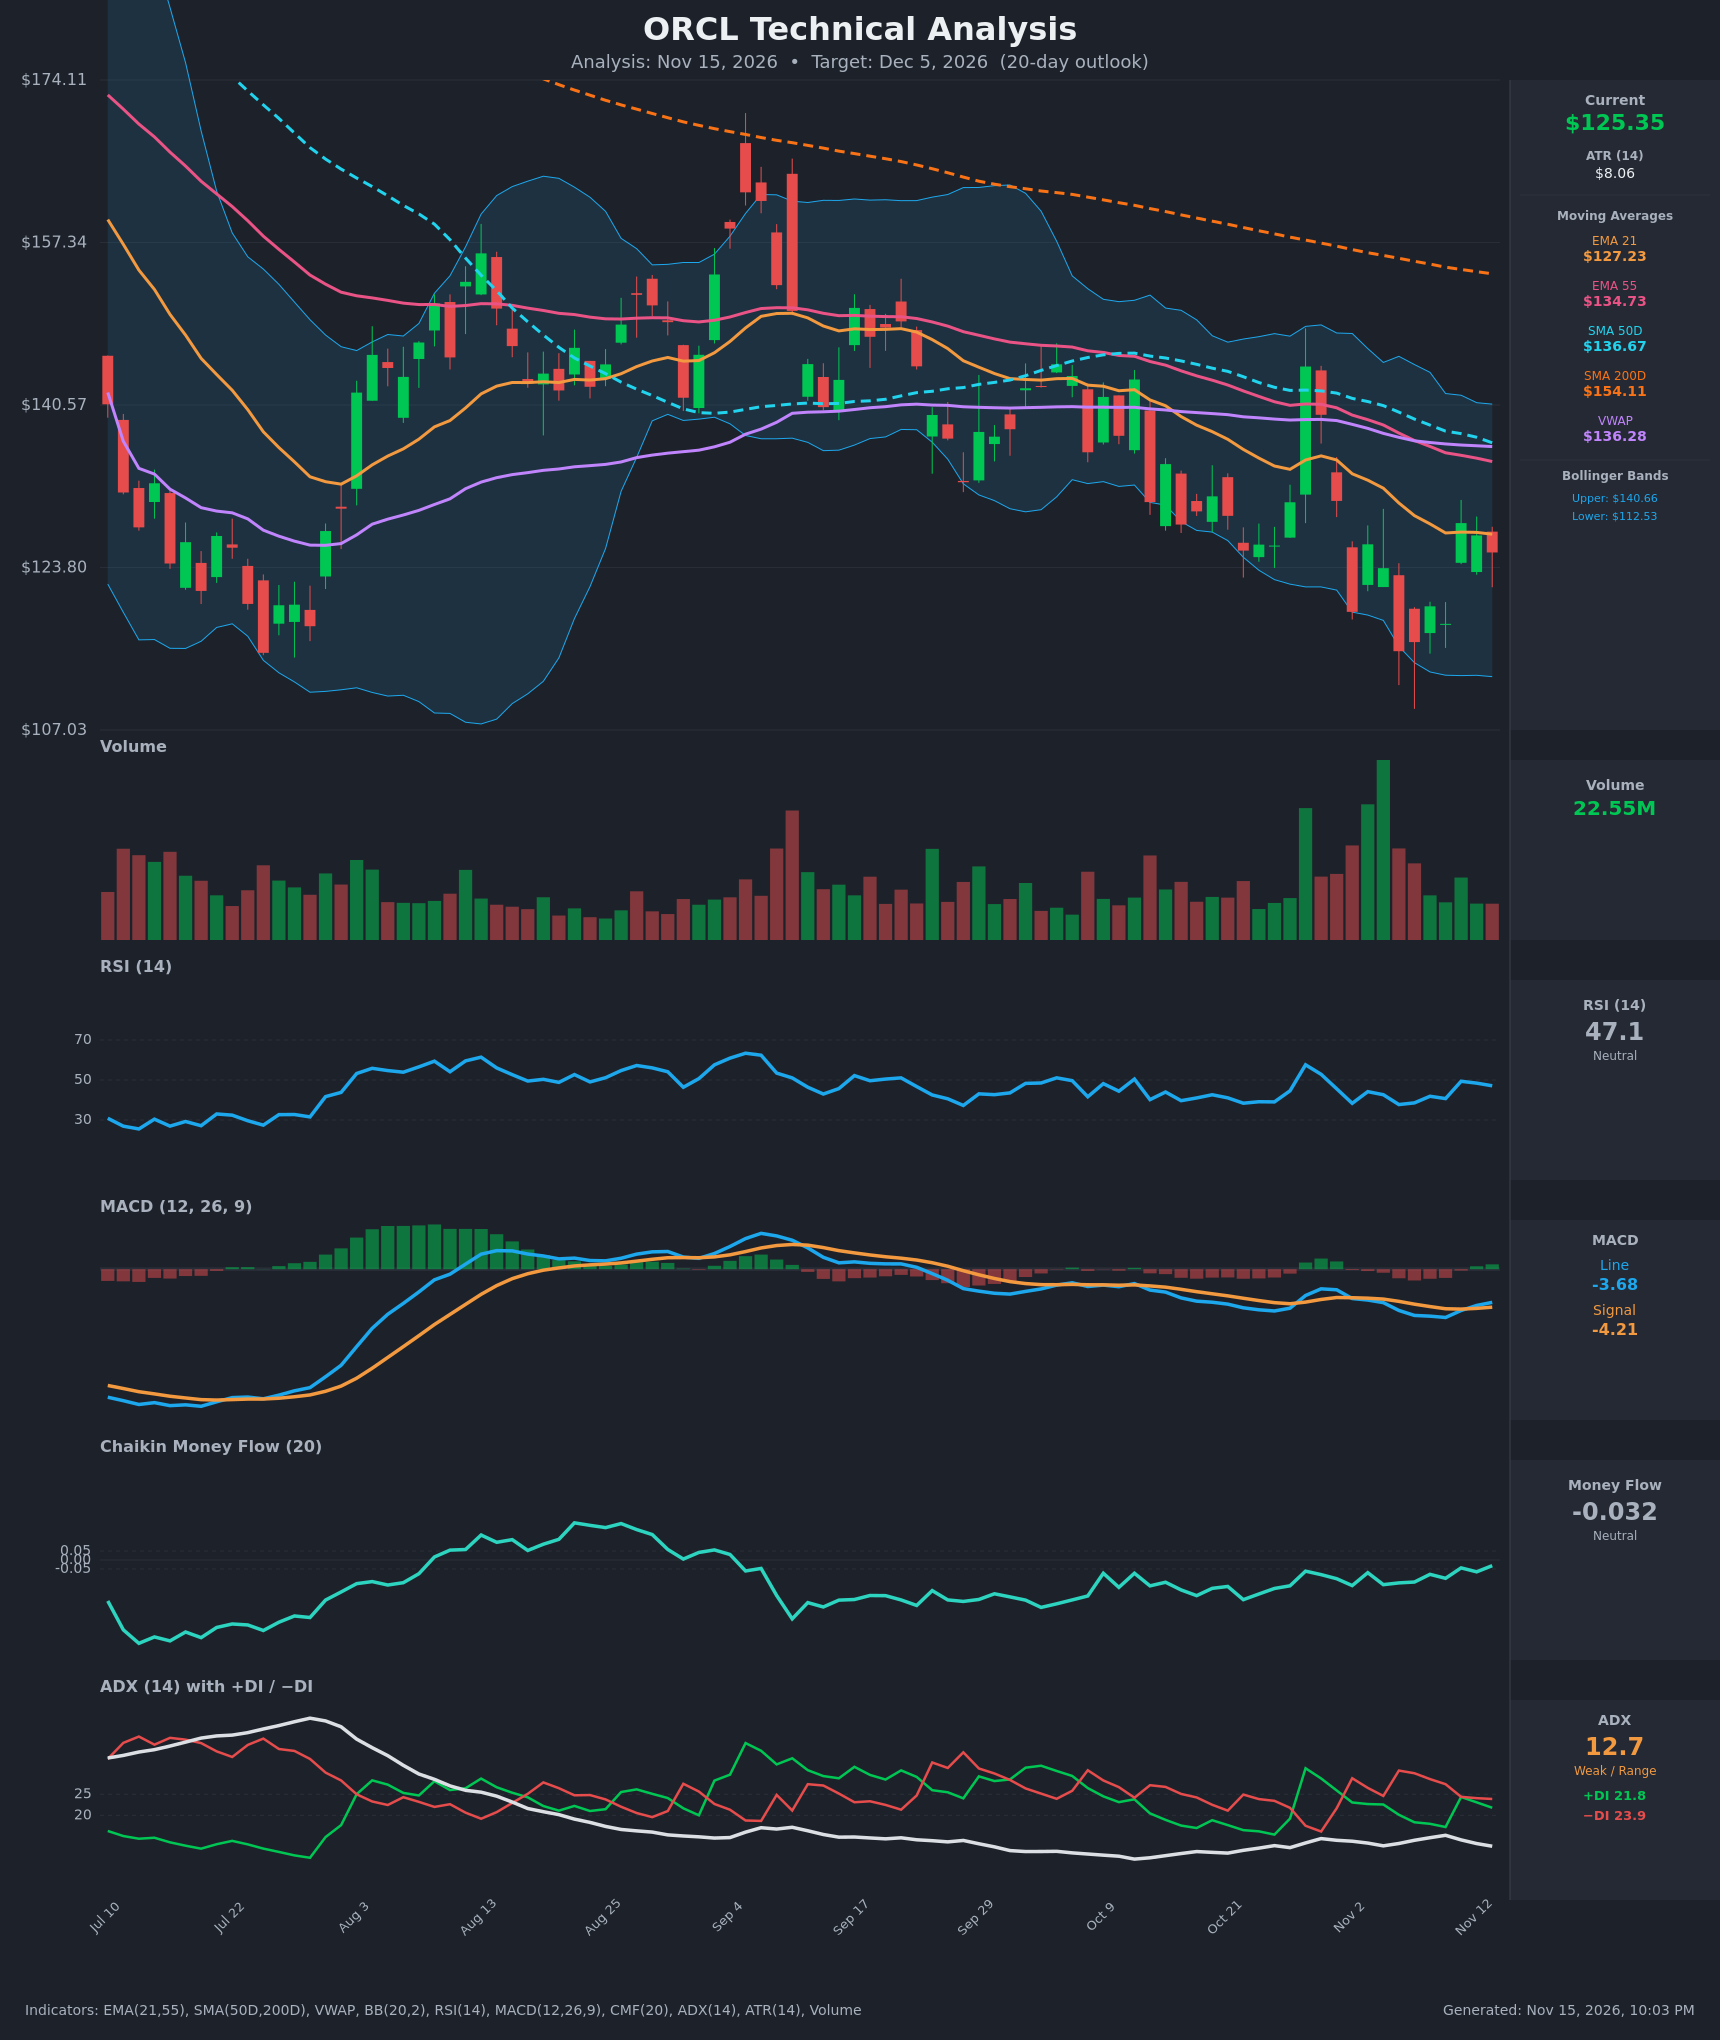
- RSI (14): 47.11, just under the 50 midline. It has recovered from 37.7 (Nov 5) but has flattened over the last three bars (49.4 → 48.4 → 47.1). It is neither overbought nor oversold, and momentum is slightly fading. [Neutral]
- 20 EMA (EMA 21): $127.23, with price at $125.35 just below it. EMA 21 is also well below EMA 55 ($134.73), so the moving averages are stacked bearishly. EMA 21 is acting as near-term resistance after price failed to hold above it on Nov 11-12. [Bearish]
- MACD: Line -3.68 against signal -4.21, so the histogram is slightly positive (~+0.53). The line crossed back above the signal on Nov 12-13, which is a bullish crossover. However, both lines are deep below zero, so this is a weak bounce inside a larger downtrend. [Neutral]
- Bollinger Bands (20): Upper $140.66, lower $112.53, midline ~$126.60. Price sits just below the midline, so it is mid-range with no squeeze or band-walk. The bands are wide (about 22% of price), reflecting high volatility from the recent $144 spike and the $115 low. [Neutral]
- CMF (20): -0.032, inside the neutral band (±0.05). It has improved from -0.159 on Oct 26, so selling pressure is easing, but there is no accumulation yet. [Neutral]
- ADX (14): 12.7, well below 20, so the trend is weak or range-bound. −DI (23.9) is only marginally above +DI (21.8), a slight bearish edge with little conviction. [Weak Trend, slight bearish tilt]
- Volume: 22.55M on the latest bar, a modest drop from the heavy spike days in late Oct and early Nov. The recent bounce has come on lighter volume, so buyers are not showing strong participation. [Neutral to slightly bearish]
DIVERGENCES & TRENDS
- Long-term trend: Price ($125.35) is below every major average: EMA 21 ($127.23), EMA 55 ($134.73), SMA 50D ($136.67), SMA 200D ($154.11) and VWAP ($136.28). SMA 50D is already well below SMA 200D, a death cross that has been in place for a while.
- Trend direction in the averages: All averages are still sloping down. SMA 200D has fallen from $158.23 to $154.11 and EMA 21 has fallen from $134.27 to $127.23 over the last 15 bars.
- RSI/price: Price made a lower low near $115 (Nov 5) and RSI bottomed around 37.7. Earlier lows in the 39 area suggest some mild bullish divergence, and RSI has held mostly in the 38-50 zone. This is not a strong signal.
- MACD: The bullish crossover is fresh, but it is occurring far below zero. The histogram has flipped positive after a series of declining readings.
- CMF: It has risen from -0.159 to -0.032, an improving trend that is still unconfirmed.
- Volatility: Large single-day swings ($144.54 on Oct 28, then $119.22 by Nov 2) show a choppy, whipsawing market. ADX near 13 confirms there is no directional trend, only a bear-market range.
- Price structure: Since Nov 5, price has held a $115-$128 range, with lower highs on the larger scale.
CHART PATTERNS
- Primary structure: A broad downtrend with a choppy range base in the $115-$129 area. The spike candle at $144.54 was a failed breakout (a bull trap), and price has made lower highs since.
- Possible Bullish Double Bottom: Lows near $115.16 (Nov 5) and $117.98 (Nov 10) could form a double bottom, with the neckline around $128-$130 (the Nov 11 high of $128.38). A close above $130 would confirm it and project a target of roughly $143-$145. It is not yet confirmed.
- Bear flag / continuation risk: After the sharp decline from $144 to $115, the current bounce looks like a weak corrective flag below falling EMA 21 and EMA 55. A break below $115 would project toward about $105 (measured move ~$10-$12).
- Reference: The chart resembles the Bearish Flag and Bullish Double Bottom templates. The bearish one is favored because the larger trend is down, ADX is weak, and price is capped below the declining averages.
POTENTIAL SCENARIOS
- Scenario 1: Bearish Range Fade / Continuation Lower — Price stays capped under EMA 21 and EMA 55, fails near $128-$130, and rolls over to retest the recent lows. The downtrend (death cross, all MAs falling, −DI above +DI) keeps the path of least resistance down. Trigger: rejection at $127-$130 and a close below $120. Target: $115-$118, with an extension to ~$110. Invalidation: daily close above $131 on rising volume. (45% probability)
- Scenario 2: Neutral Choppy Consolidation — Price oscillates between $115 and $130 with weak ADX and fading volatility, and ends the window near the middle. Trigger: failure to break either $115 or $130. Target: $120-$128. Invalidation: close outside the $113-$132 range. (25% probability)
- Scenario 3: Bullish Double-Bottom Breakout — The fresh MACD crossover and improving CMF carry over, price clears $128-$130 and squeezes toward the Bollinger midline/upper area and SMA 50D. Trigger: close above $130 with volume. Target: $136-$140. Invalidation: close back below $122. (30% probability)
PRICE TARGETS
- Target Price: $121.50 (20-day horizon)
- Expected Range: $111.00 to $131.50. The width is $20.50, about 16.4% of the current price, which fits the 14-21 day scale (roughly 8-12%) at the wide end, justified by ATR of $8.06 and the elevated volatility.
- Key Levels: Support at $115.16, Resistance at $130.00
OVERALL BIAS
OVERALL BIAS: BEARISH - Price is below all major moving averages (including a long-standing death cross), the EMAs are stacked bearishly, −DI sits above +DI, and volume does not support the bounce. The fresh MACD crossover and CMF improvement are too weak (ADX 12.7) to overturn the downtrend, so a modest drift toward the $115-$120 support zone is favored.
This is educational analysis and not financial advice.