ORCL 4-day bearish forecast — Nov 1, 2026
- Bias: Bearish
- Timeframe: 4 days (made Nov 1, 2026, target date Nov 4, 2026)
- Price at analysis: $130.69
- Price target: $128.50
- Expected range: $125.00 – $133.00
- Result: Correct (-5.3%) — closed at $123.73 on Nov 4, 2026; quality score 77/100
Get a free AI analysis of ORCL today
Analysis
TECHNICAL INDICATORS
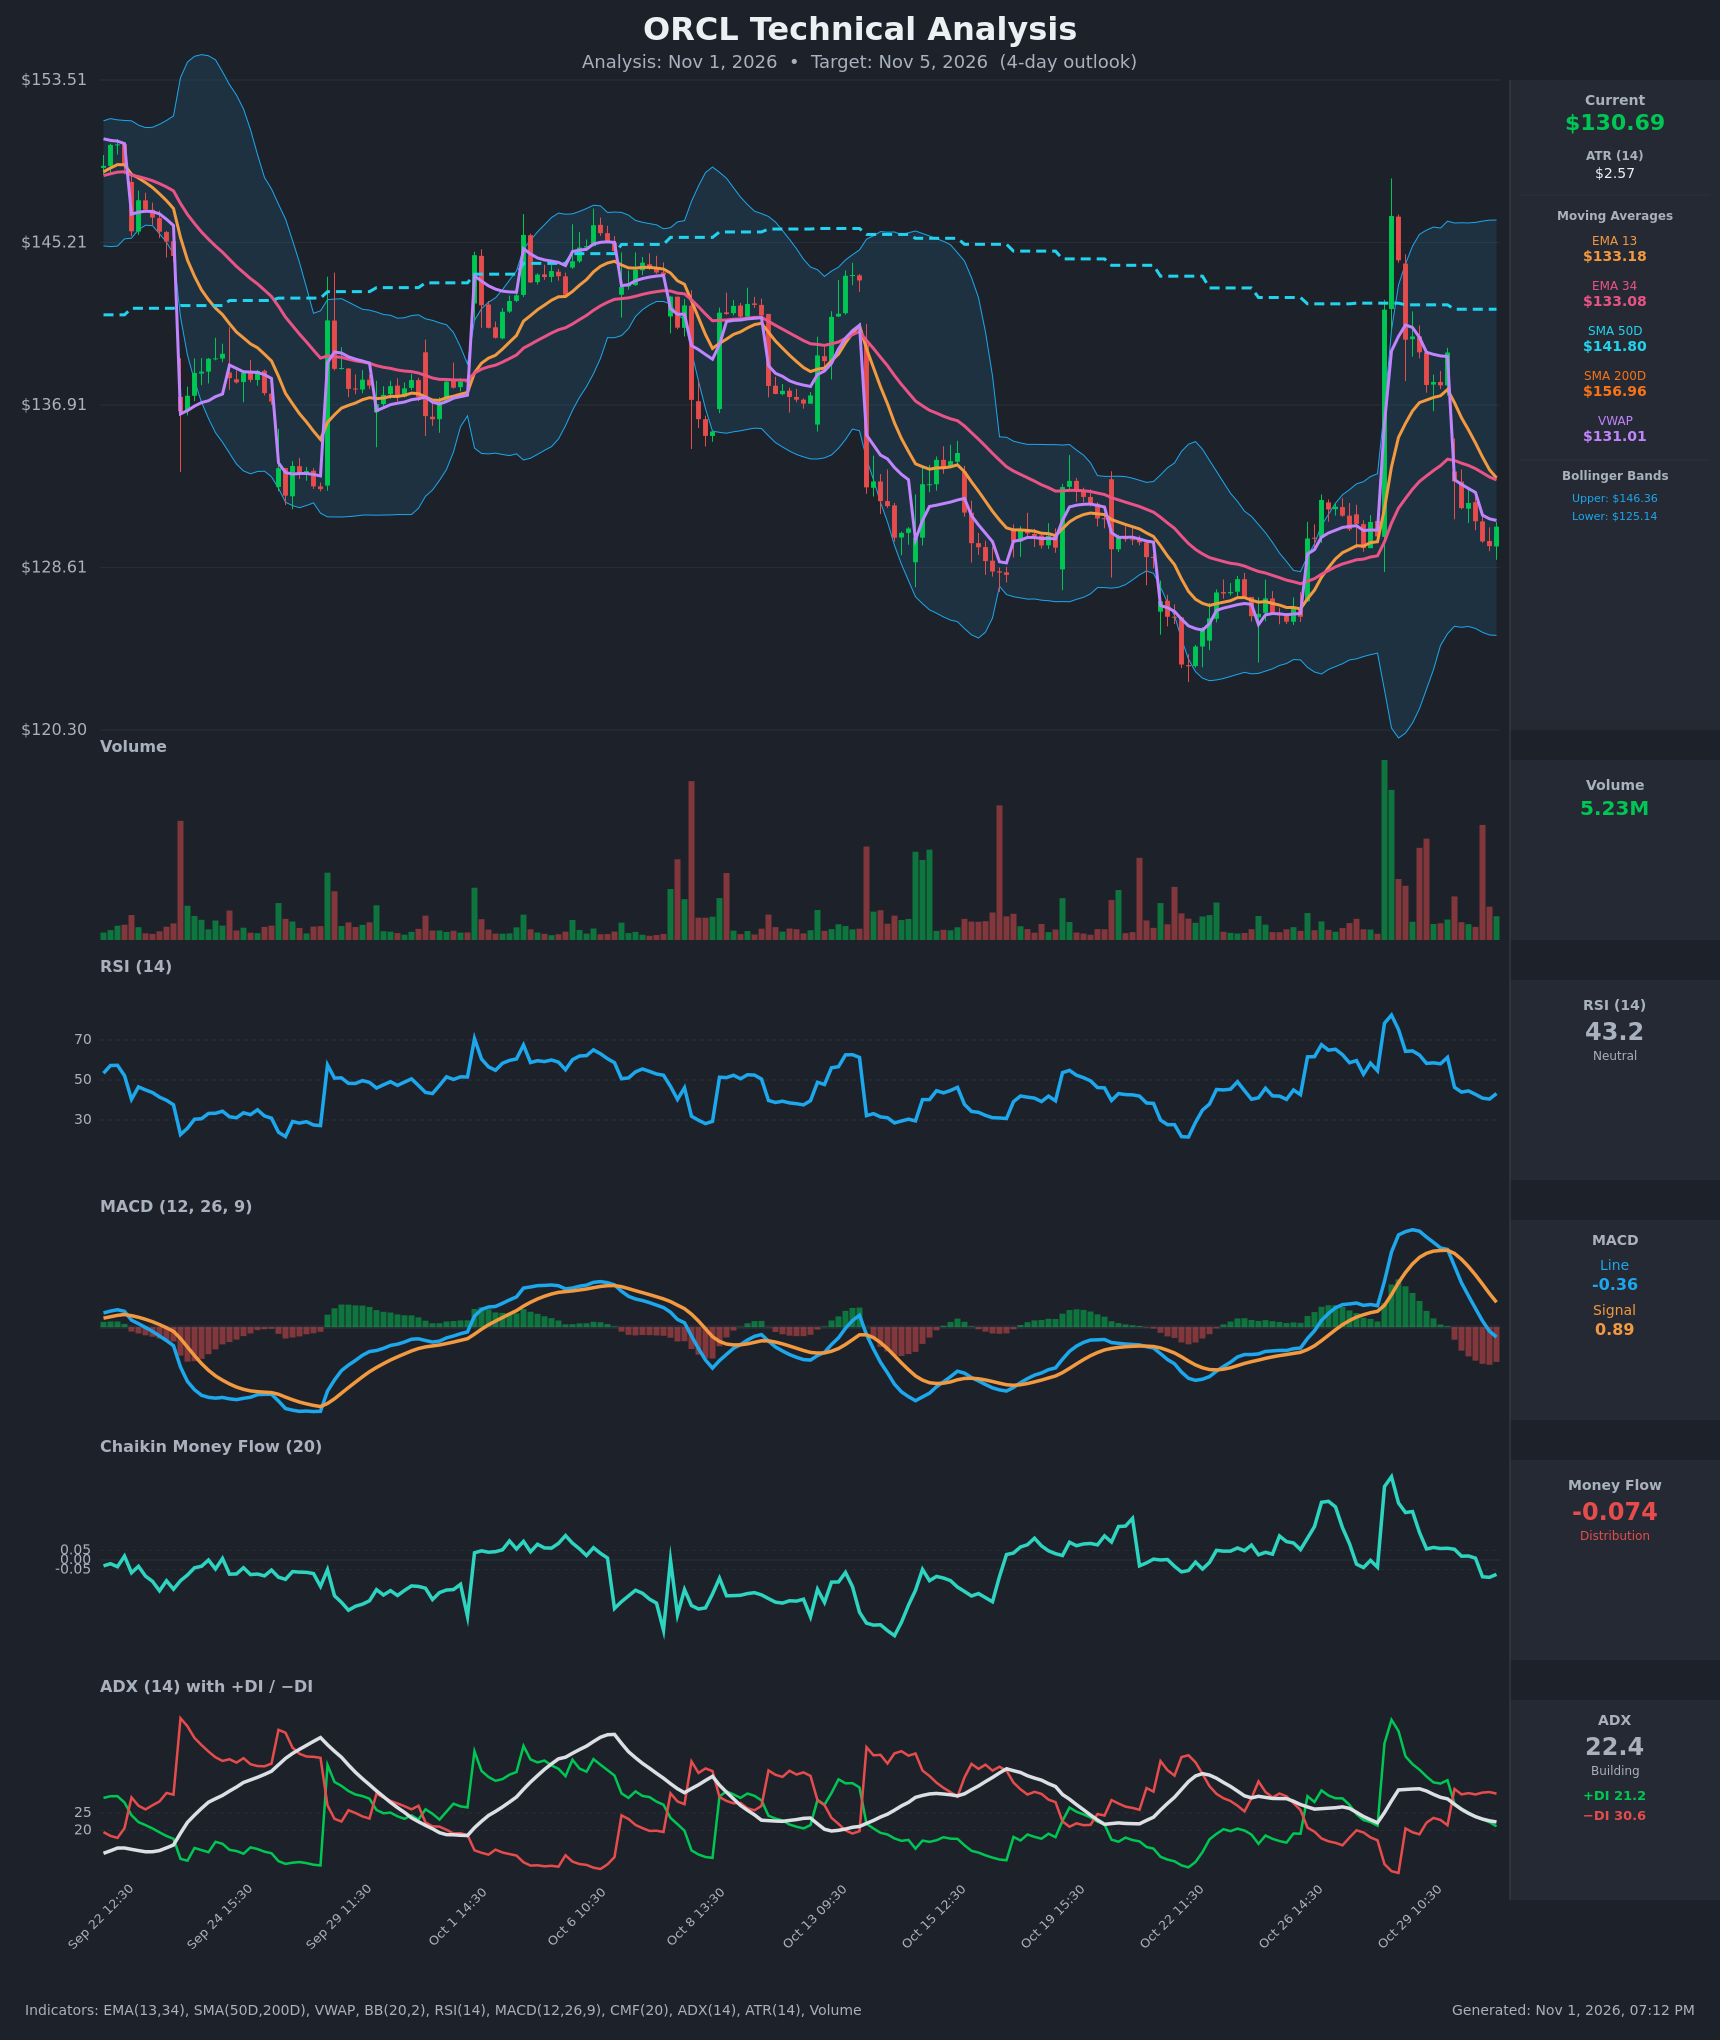
- RSI (14): 43.24, down from 75 on Oct 28 and recovering slightly from 40.5 at the last low. It sits below the 50 midline but is not oversold, so momentum is soft with a small uptick. [Bearish]
- EMA 13 / EMA 34 (short-term trend): EMA13 is $133.18 and EMA34 is $133.08. EMA13 just crossed below EMA34 or is about to (the gap is ~$0.10 and shrinking fast). Price at $130.69 is below both, so they act as overhead resistance around $133. [Bearish]
- MACD: Line -0.36 is below Signal 0.89, a bearish crossover that occurred on Oct 30 afternoon. The histogram is negative and widening, and both lines are falling from the Oct 28 spike. [Bearish]
- Bollinger Bands (20): Upper $146.36, lower $125.14, midline roughly $135.7. Price is in the lower half, about 26% of the band width above the lower band. The bands are wide after the earnings-style spike, so volatility is elevated, with no squeeze and no band-walk. [Neutral]
- CMF (20): -0.074, below the -0.05 threshold. It fell from +0.29 to negative, which signals a shift from accumulation to distribution. [Distribution]
- ADX (14): 22.4 and falling from 32. −DI at 30.6 is above +DI at 21.2, so bears lead. The trend is weak-to-moderate and fading, but its direction is down. [Weak Trend, Bearish direction]
- Volume: 5.23M is moderate. The large green spike on Oct 28 was a one-day pop, and the subsequent selling has been on average to above-average volume, with a heavy red bar on Oct 30. Price is below VWAP ($131.01), which points to sellers in control intraday. [Bearish]
DIVERGENCES & TRENDS
- There is no clear divergence. RSI and MACD both confirm the price decline from the Oct 28 gap-up high ($144).
- The Oct 28 spike has been almost fully retraced. Price gave back the gap and sits just above the Oct 22-26 base near $123-126.
- Moving averages are in bearish alignment: price < EMA13 ≈ EMA34 < SMA50 ($141.80) < SMA200 ($156.96). The long-term trend is clearly down.
- Fresh bearish crossovers: MACD under signal, −DI over +DI, and EMA13 converging on EMA34 from above.
- ADX is fading, so the selloff is losing some strength. A bounce toward the EMAs is possible but would likely meet resistance.
CHART PATTERNS
- The broader picture is a failed rally. The spike to ~$144-148 reversed sharply, which resembles a short-lived bearish reversal (a bull trap) inside a larger downtrend.
- The Oct 22-26 base near $123-126 looks like a possible double bottom or rounded base. The neckline is far above, near $145, so it is not relevant in 4 days.
- The current pullback is a lower high after the spike. A break below roughly $129 would open a retest of the $125 lower Bollinger Band and the Oct 22 low (~$123).
- The reference "Bearish Flag/Pennant" fits loosely at best. There is no clean pattern, so the indicators carry more weight.
POTENTIAL SCENARIOS
- Scenario 1: Bearish Continuation Lower — Price stays under the 13/34 EMA cluster and VWAP, with MACD and DI pressure pushing it toward the lower band. Trigger: break below $129.50 (the Oct 30 low is ~$129.70). Target: $126.50-$127.50, with an extension to $125. Invalidation: close above $133.50. (50% probability)
- Scenario 2: Neutral Range/Chop — Price consolidates above the Oct 30 low and below the EMA cluster, with ADX fading. Trigger: holds $129-$133. Target: $129.50-$132.50. Invalidation: break outside $128.50 or $134. (25% probability)
- Scenario 3: Bullish Relief Bounce — RSI turns up off 40 and price reclaims the EMAs and VWAP. Trigger: close above $133.20. Target: $135.50-$136 (the Bollinger midline). Invalidation: back below $130. (25% probability)
PRICE TARGETS
For a 4-day horizon, the expected range width should be about 5-6% of price (~$7.00), a little wider than the 2-3 day guidance given the ATR of $2.57.
- Target Price: $128.50
- Expected Range: $125.00 to $133.00 (width $8.00 ≈ 6.1% of the current price)
- Key Levels: Support at $125.14, Resistance at $133.18
OVERALL BIAS
OVERALL BIAS: BEARISH - Price is below the EMAs and VWAP with a fresh bearish MACD crossover, −DI over +DI, and CMF in distribution. The structure sits under a declining SMA50/SMA200, so the path of least resistance is a drift toward $125-$128 over the next 4 days.
This is educational analysis and not financial advice.