XLF 4-day bullish forecast — Nov 1, 2026
- Bias: Bullish
- Timeframe: 4 days (made Nov 1, 2026, target date Nov 4, 2026)
- Price at analysis: $56.53
- Price target: $56.80
- Expected range: $55.80 – $57.40
- Result: Correct (+4.5%) — closed at $59.08 on Nov 4, 2026; quality score 65/100
Get a free AI analysis of XLF today
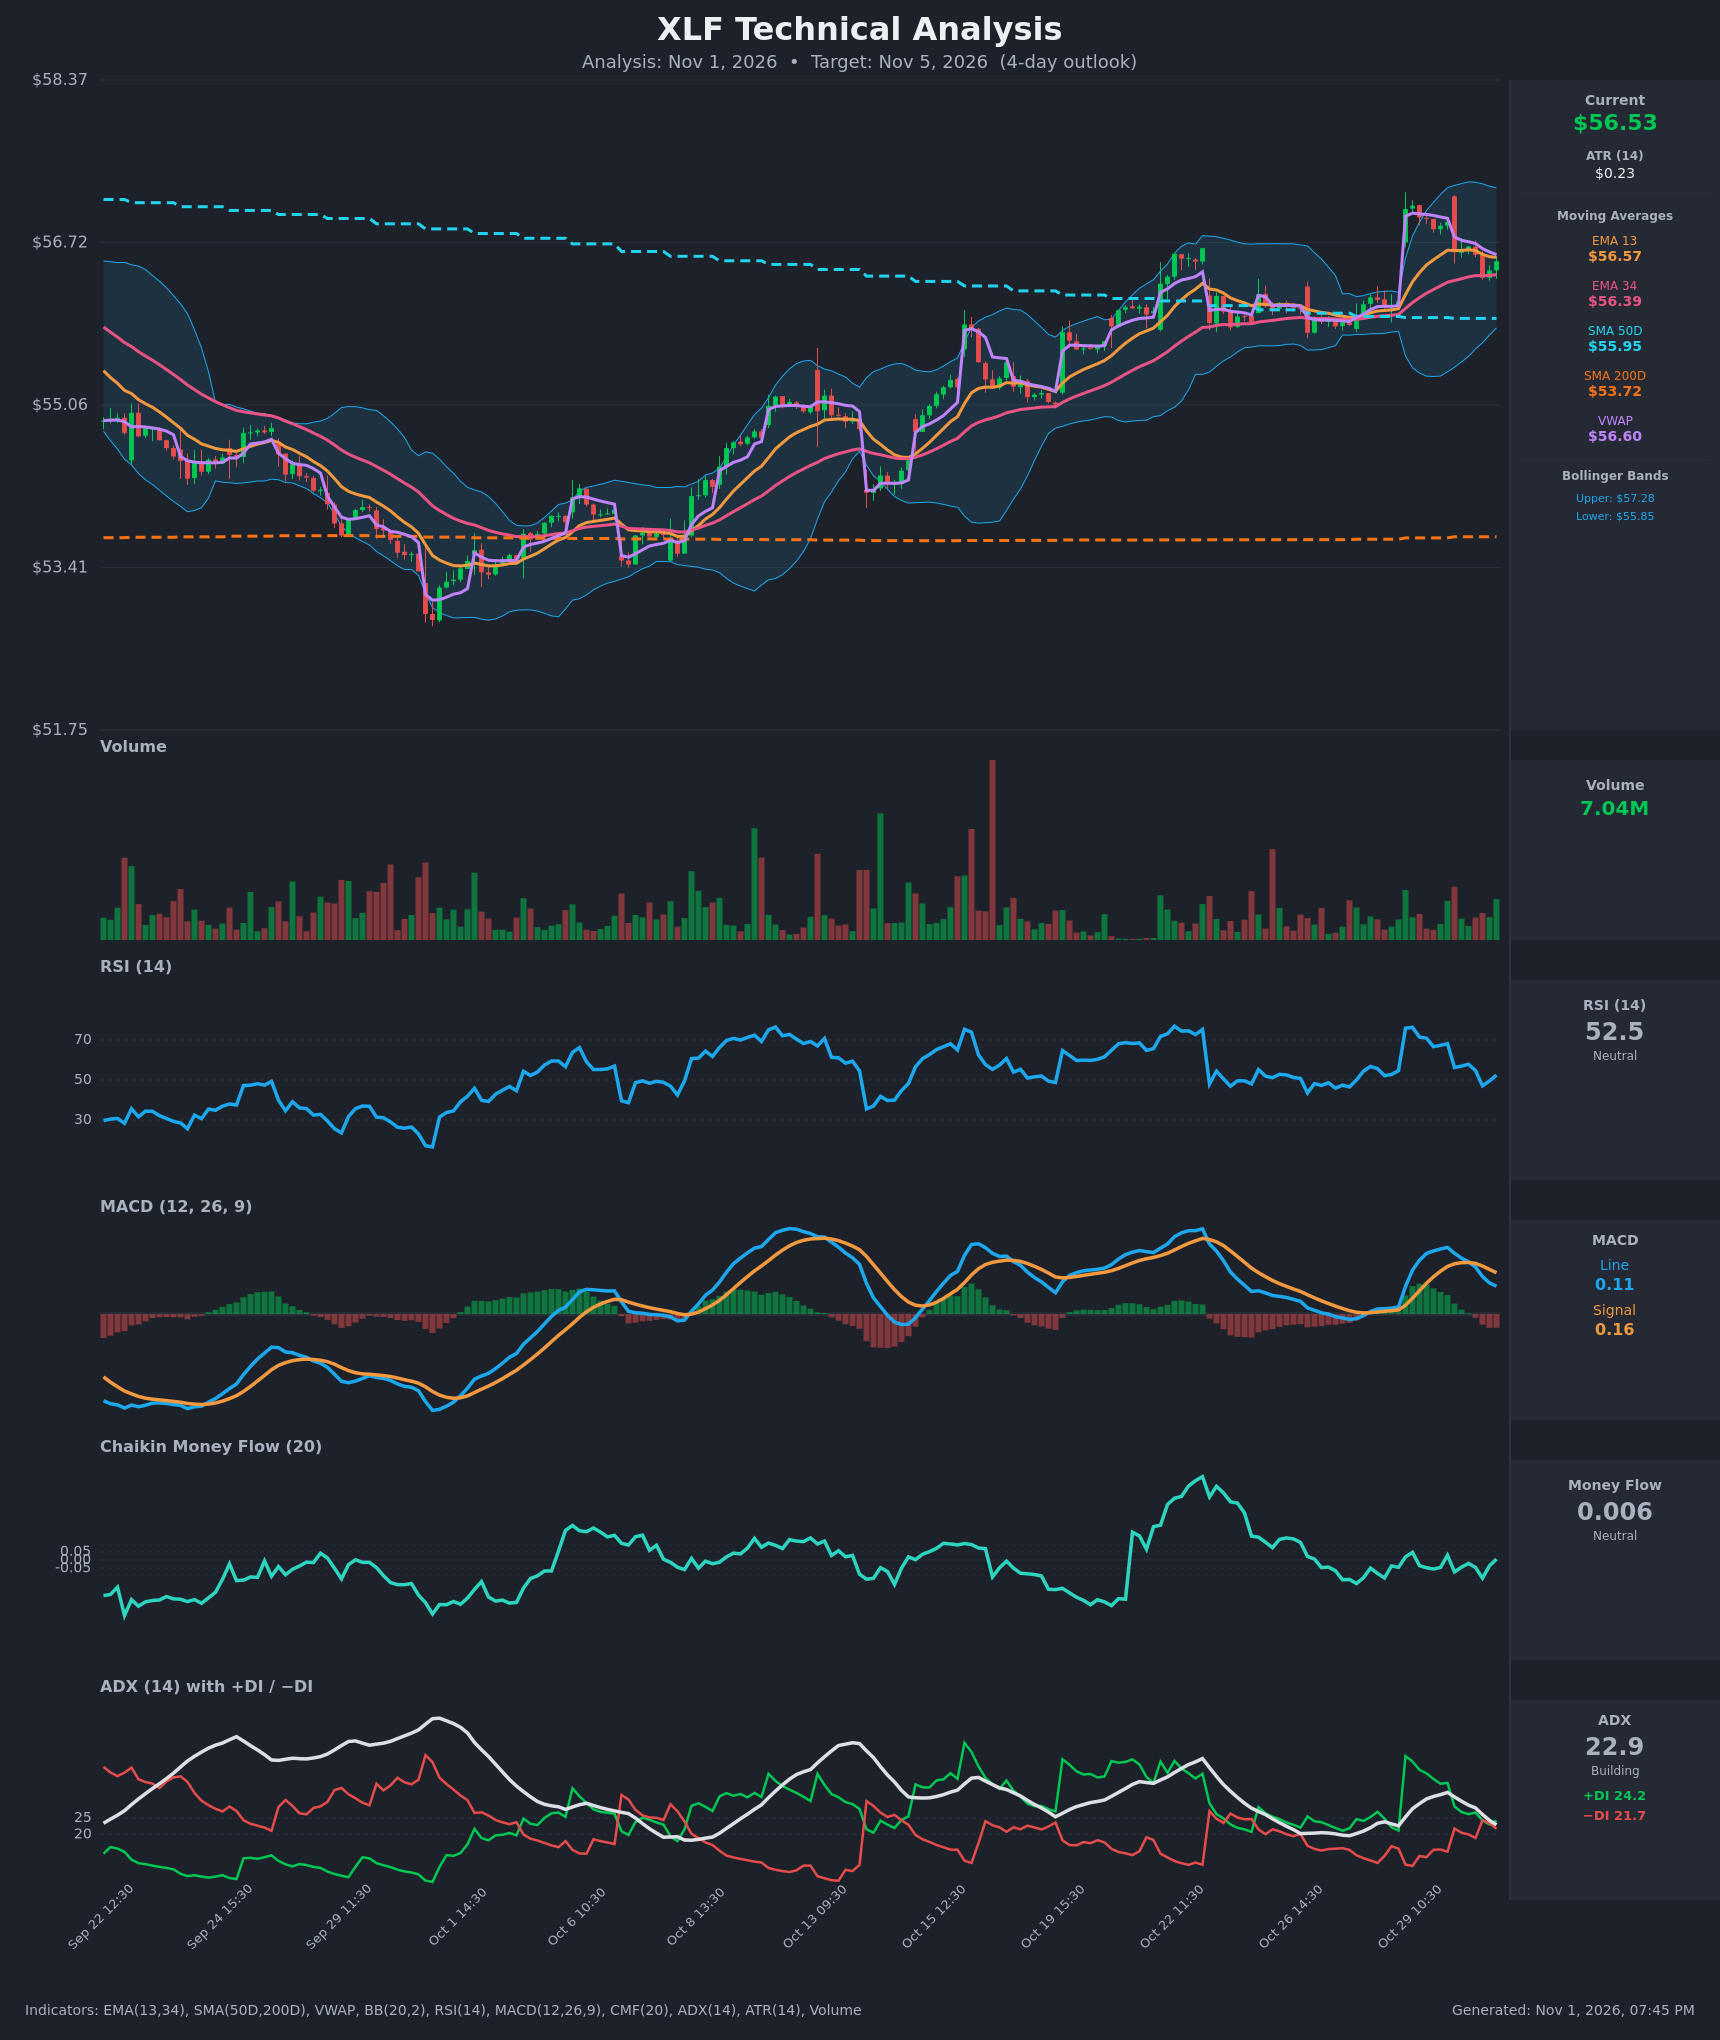
Analysis
TECHNICAL INDICATORS
- RSI (14): 52.48, neutral. It has bounced from 47.1 (Oct 30 13:30) after cooling from the 76 overbought spike on Oct 29, so momentum is turning up from a reset. [Neutral]
- 20 EMA: The chart shows EMA 13/34 rather than a 20 EMA. EMA13 is $56.57 and EMA34 is $56.39. Price at $56.53 sits just under EMA13 (minor resistance) and above EMA34 (support). EMA13 is above EMA34, so the short-term structure is still positive but the gap is narrowing. [Neutral]
- MACD: Line 0.1075 is below signal 0.1594, with a negative histogram of about -0.05. The bearish cross happened on Oct 30 and the line is still falling toward zero. Momentum is fading after the spike. [Bearish]
- Bollinger Bands (20): Upper is $57.28, lower is $55.85, and the middle is about $56.56. Price is pinned at the midline with moderately wide bands. This is neither overextended nor squeezed. [Neutral]
- CMF (20): 0.006, inside the ±0.05 neutral zone. It has faded from its Oct 22 peak and shows neither accumulation nor distribution. [Neutral]
- ADX (14): 22.9 and falling from 32.8, so the trend is weak to moderate and cooling. +DI at 24.2 has just edged back above −DI at 21.7, after the two touched at 24.3 on Oct 30. That is a marginal bull edge. [Weak Trend, slight bullish]
- Volume: 7.04M, average. It is subdued during the pullback from the Oct 29 gap, with no heavy distribution volume. Price is slightly below VWAP ($56.60). [Neutral]
DIVERGENCES & TRENDS
- There is no clear price/indicator divergence. RSI and MACD peaked on the Oct 29 gap-up and have cooled since, consistent with price giving back part of the move.
- The MACD bearish cross (Oct 30) is a short-term caution. The histogram is still negative but shallow, so it could flatten quickly if price holds.
- ADX has fallen from over 32 to under 23, so the impulse is fading and the market is moving toward consolidation. The +DI/−DI cross back to +DI on top is a small positive.
- The longer-term structure is bullish. Price is above SMA50 ($55.95) and SMA200 ($53.72), SMA50 is above SMA200 (golden cross already in place), and EMA13 is above EMA34.
- Price is slightly below VWAP and EMA13, so intraday buyers are not yet clearly in control.
CHART PATTERNS
- After the sharp Oct 29 gap from $56.12 to $57.10, price is drifting lower in a tight, slightly descending channel between about $56.36 and $56.70. This resembles a Bullish Flag / Pennant (continuation) from the reference diagram.
- The pole is roughly $1.00, which would project a breakout target near $57.4–57.5 on a move above about $56.70. The pattern is only a loose fit because the pullback has been short and the MACD cross is bearish. A breakdown below $56.36 would negate the flag and expose $55.95.
- Price is also consolidating inside a broader ascending channel from the early-October lows.
POTENTIAL SCENARIOS
- Scenario 1: Bullish Flag Breakout — Price holds the EMA34/$56.39 area, reclaims EMA13/VWAP, and the flag resolves upward as MACD flattens and turns up. Trigger: hourly close above $56.70. Target: $57.10–$57.40 (prior high and upper Bollinger Band). Invalidation: close below $56.36. (45% probability)
- Scenario 2: Neutral Range Chop — ADX keeps fading and price oscillates around the Bollinger midline between about $56.30 and $56.80. Trigger: failure to break either side of the flag. Target: $56.50–$56.60. Invalidation: a decisive break of $56.30 or $56.80. (20% probability)
- Scenario 3: Bearish Flag Failure — The negative MACD cross and sub-VWAP price lead to a deeper retracement of the gap. Trigger: close below $56.36 (EMA34 and recent low). Target: $55.95 (SMA50), possibly the $55.85 lower band. Invalidation: reclaim of $56.70. (35% probability)
PRICE TARGETS
- Target Price: $56.80 (4-day horizon)
- Expected Range: $55.80 to $57.40. The width is $1.60, or about 2.8% of the current price, which fits the 2-4% guidance for a short horizon.
- Key Levels: Support at $56.39, Resistance at $57.10
OVERALL BIAS
OVERALL BIAS: BULLISH - The long-term trend structure is intact: price is above the rising SMA50 and SMA200, EMA13 is above EMA34, +DI has retaken the lead, and the post-gap pullback looks like a bullish flag. The bearish MACD cross and the price sitting slightly below VWAP temper conviction, so the expected upside is modest.
This is educational analysis and not financial advice.