XLF 27-day bullish forecast — Nov 15, 2026
- Bias: Bullish
- Timeframe: 27 days (made Nov 15, 2026, target date Dec 11, 2026)
- Price at analysis: $58.68
- Price target: $59.70
- Expected range: $54.90 – $62.40
- Result: Pending — graded after the close on Dec 11, 2026
Get a free AI analysis of XLF today
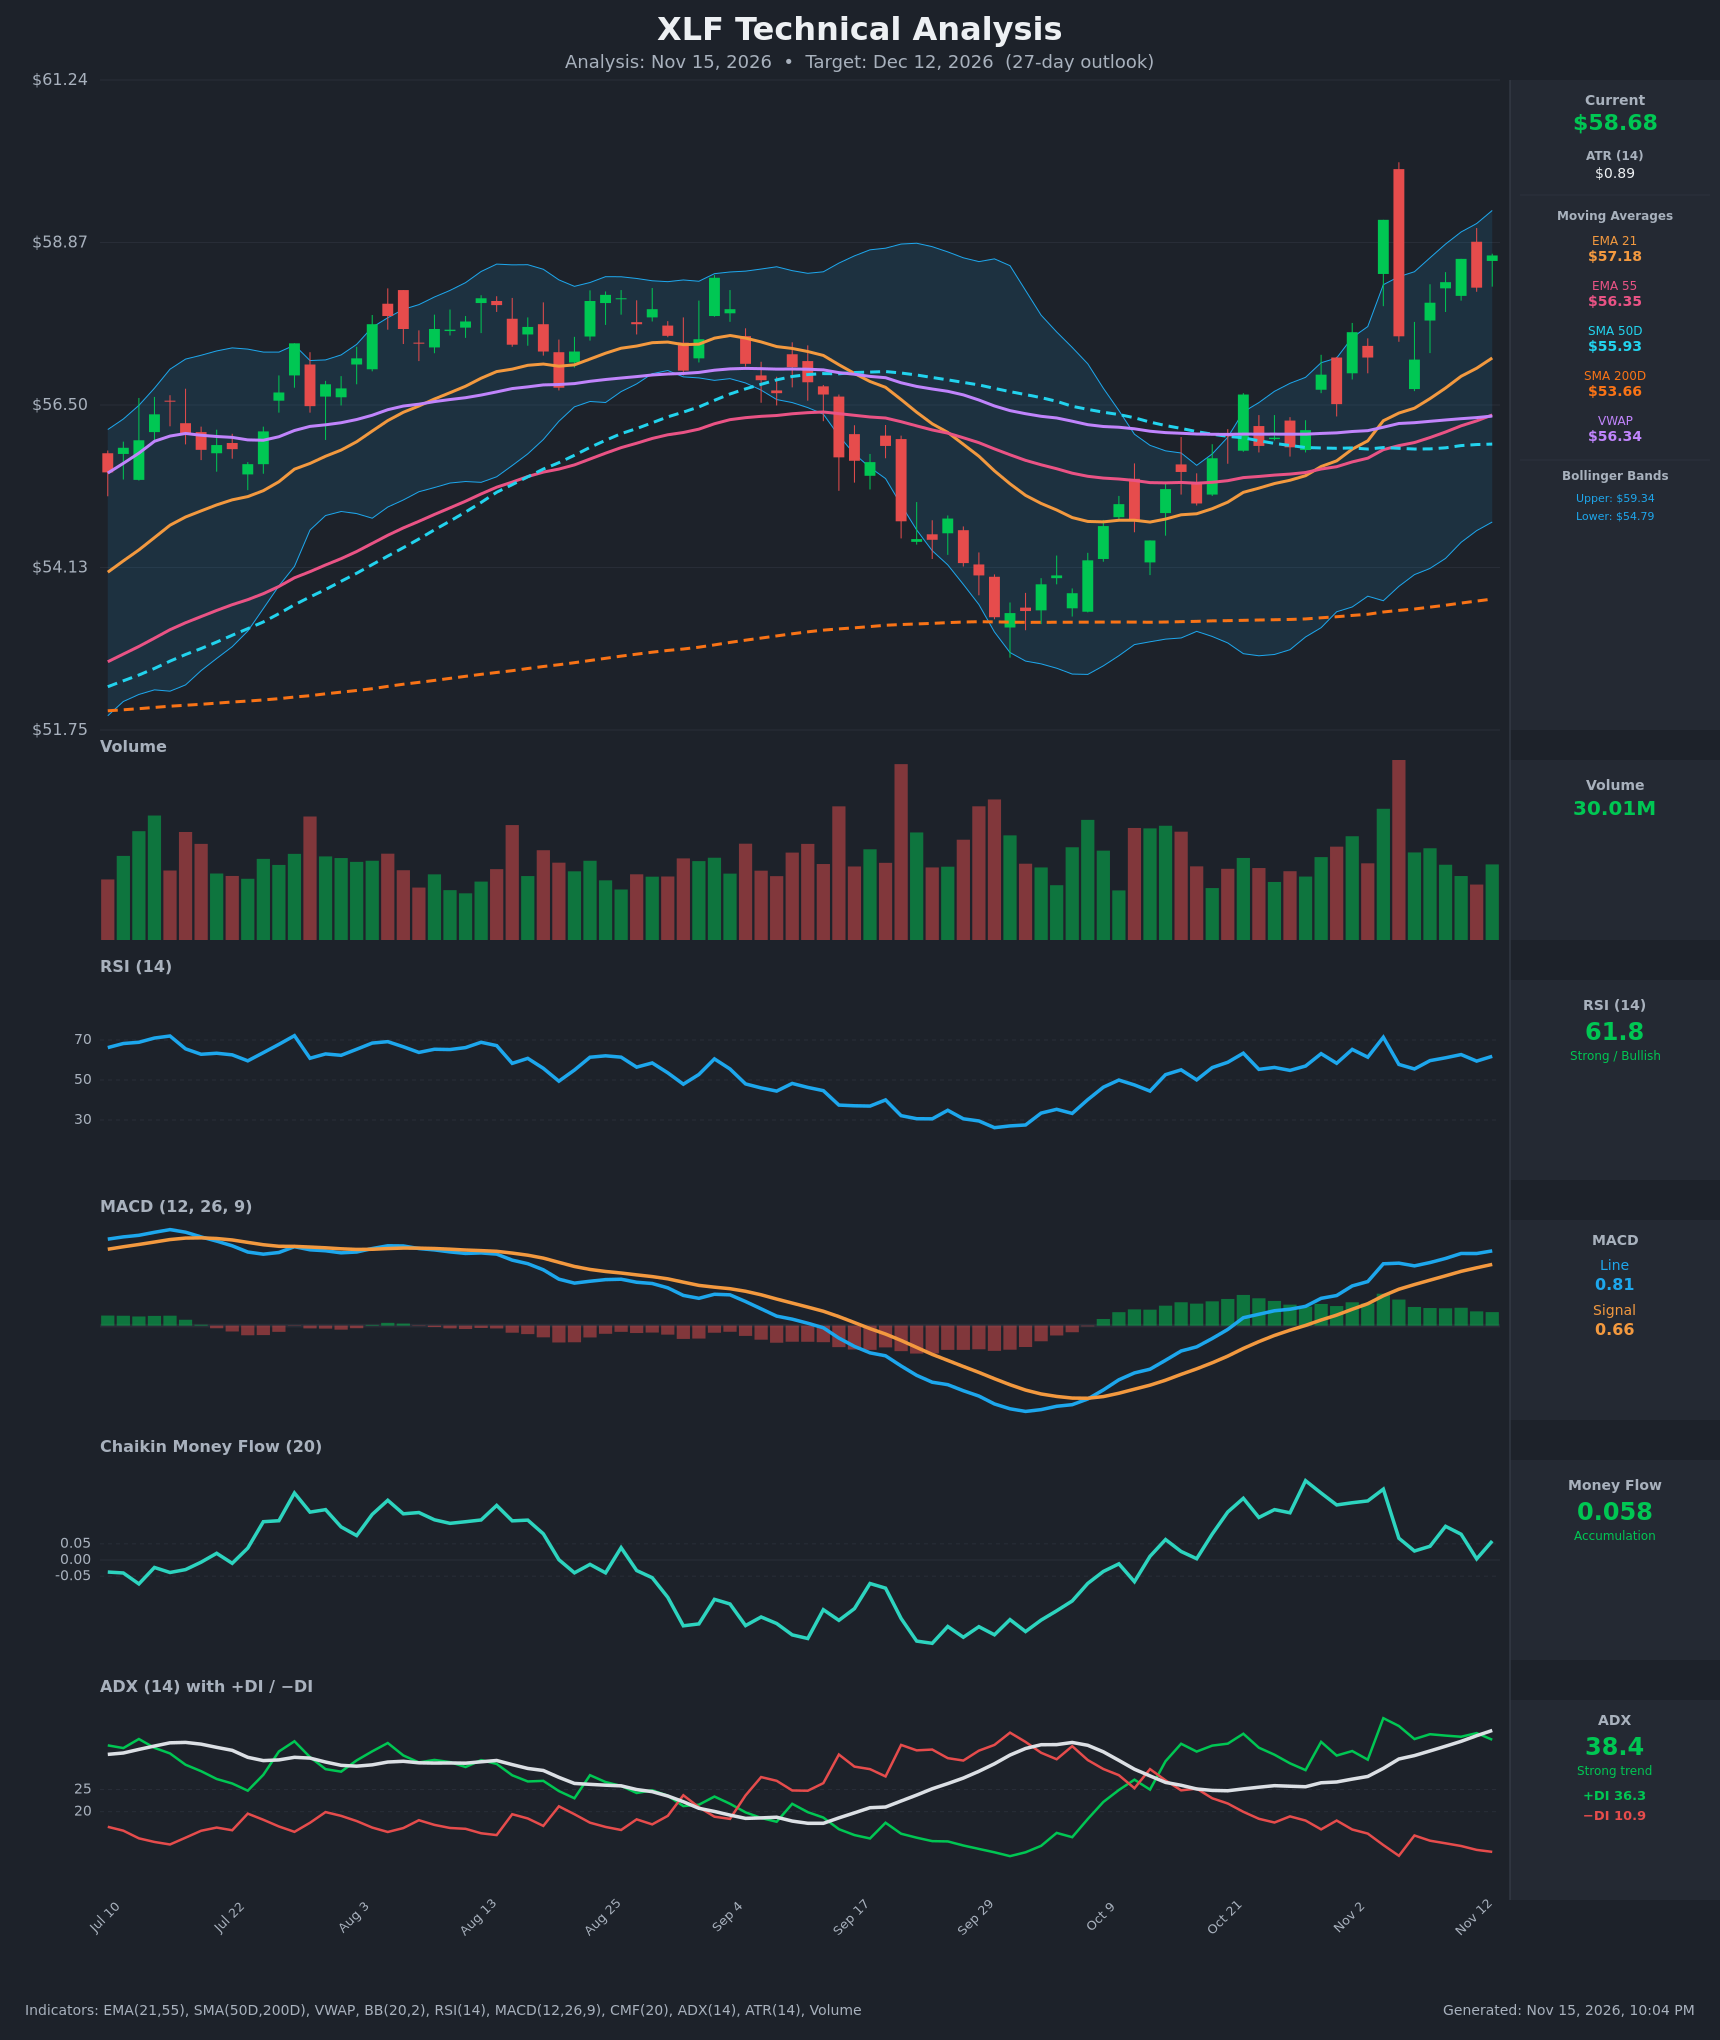
Analysis
TECHNICAL INDICATORS
- RSI (14): 61.84, in the bullish zone and below overbought. It dipped from 71.4 on Nov 4 and has held in the mid-50s to low-60s since, so momentum is firm but not stretched. [Bullish]
- 20 EMA (EMA 21): $57.18, with price at $58.68 about 2.6% above it. The EMA 21 is rising steeply and acts as dynamic support. EMA 21 is also well above EMA 55 ($56.35), and the bullish stack continues. [Bullish]
- MACD: The line at 0.806 is above the signal at 0.660, a positive spread of about 0.15. The histogram is positive and has widened gently over the last few sessions. The line has been above the signal since Oct 28, so momentum is still bullish with no sign of rolling over. [Bullish]
- Bollinger Bands (20): Upper $59.34, lower $54.79, with price at $58.68 in the upper quarter of the bands. It is near the upper band but not breaking out. Price is "walking the band" in a strong trend, though the Nov 4 spike to $59.20 was rejected. [Bullish]
- CMF (20): 0.058, just above the +0.05 accumulation threshold. It has faded from the 0.2 area in early November and dipped to 0.004 on Nov 12, so buying pressure is positive but weakening. [Accumulation]
- ADX (14): 38.4 and rising, with +DI at 36.3 and −DI at 10.9. This is a strong uptrend with bulls firmly in control. Trend strength is high, though readings above 35-40 can precede consolidation. [Strong Trend + Bullish]
- Volume: 30.01M, roughly average. The Nov 4 spike bar was large but reversed, and volume has been unremarkable on the grind higher. Participation is adequate but not confirming with expansion. [Neutral to mildly supportive]
DIVERGENCES & TRENDS
- Divergence: Price is near the Nov 4 high zone ($59.20 intraday and close), while RSI (61.8 vs 71.4) and CMF (0.058 vs 0.22) are lower. This is mild bearish divergence in momentum and money flow, and it suggests a pause or consolidation near $59-60 is likely.
- Trend alignment: Price ($58.68) > EMA 21 ($57.18) > EMA 55 ($56.35) > SMA 50D ($55.93) > SMA 200D ($53.66), with VWAP at $56.34 below price. This is a fully bullish stacked structure.
- Crossovers: EMA 21 crossed above EMA 55 in late October. SMA 50D is well above SMA 200D, so the golden cross is long established. MACD has been above its signal for about two weeks, and +DI has been far above −DI since mid-October.
- Recovery: Price has rallied about 11% from the late-September low near $53, which is a V-shaped recovery that reclaimed all key averages.
- Prior range: The August-September peak near $58 is now cleared, which turns that zone into support.
CHART PATTERNS
- Bullish Inverted Head and Shoulders / Double Bottom (reversal): The late-September low near $53 (found right at the SMA 200D) and the earlier base fit a broad V-reversal. The breakout above the prior $57.5-58 resistance is the confirmation.
- Bullish Flag (continuation): The Nov 4 spike followed by a tight sideways-to-higher consolidation between $57.2 and $58.7 resembles a small flag or pennant. A breakout above $59.20 would imply a measured move of about $2 to $61.
- Targets: The flag-based target is around $60.5-61. The pattern fails if price closes below the EMA 21, around $57.
POTENTIAL SCENARIOS
- Scenario 1: Bullish Flag Breakout Continuation — Price clears the $59.20-59.34 resistance and the Bollinger upper band, and the strong ADX trend carries it higher. Trigger: daily close above $59.40 on rising volume. Target: $60.50-$61.00. Invalidation: close below $57.00 (the EMA 21). (52% probability)
- Scenario 2: Neutral Consolidation / Pullback to the EMA — Divergences in RSI and CMF cause a pause, and price retraces toward the EMA 21 and then grinds sideways. Trigger: rejection near $59.30 with RSI falling below 55. Target: $57.20-$58.50. Invalidation: a break above $59.40, or a break below $56.35. (33% probability)
- Scenario 3: Bearish Failed Breakout Reversal — The rejection of the Nov 4 high becomes a double top, and price breaks the EMA 21 and EMA 55. Trigger: close below $56.30 with MACD crossing below its signal. Target: $55.00-$55.90 (the SMA 50D area). Invalidation: close back above $58.50. (15% probability)
PRICE TARGETS
For the 27-day timeframe (the 30-60 day guidance of 12-18% is the closest band, scaled slightly lower for 27 days), the range width is about 13% of price.
- Target Price: $59.70 (for Dec 12, 2026, about +1.7%)
- Expected Range: $54.90 to $62.40. The width is $7.50, or about 12.8% of current price, which fits the 27-day timeframe.
- Key Levels: Support at $57.18 (EMA 21), Resistance at $59.34 (upper Bollinger Band / Nov 4 high zone)
OVERALL BIAS
OVERALL BIAS: BULLISH - Price is above all key moving averages in a fully stacked uptrend, with ADX at 38 and +DI far above −DI, and MACD is positive and widening. The mild RSI/CMF divergence argues for some consolidation near $59, but the trend and the flag structure favor a modest upward drift toward $59.70 over 27 days.
This is educational analysis and not financial advice.