XLF 20-day bullish forecast — Nov 15, 2026
- Bias: Bullish
- Timeframe: 20 days (made Nov 15, 2026, target date Dec 4, 2026)
- Price at analysis: $58.68
- Price target: $59.80
- Expected range: $55.70 – $61.30
- Result: Pending — graded after the close on Dec 4, 2026
Get a free AI analysis of XLF today
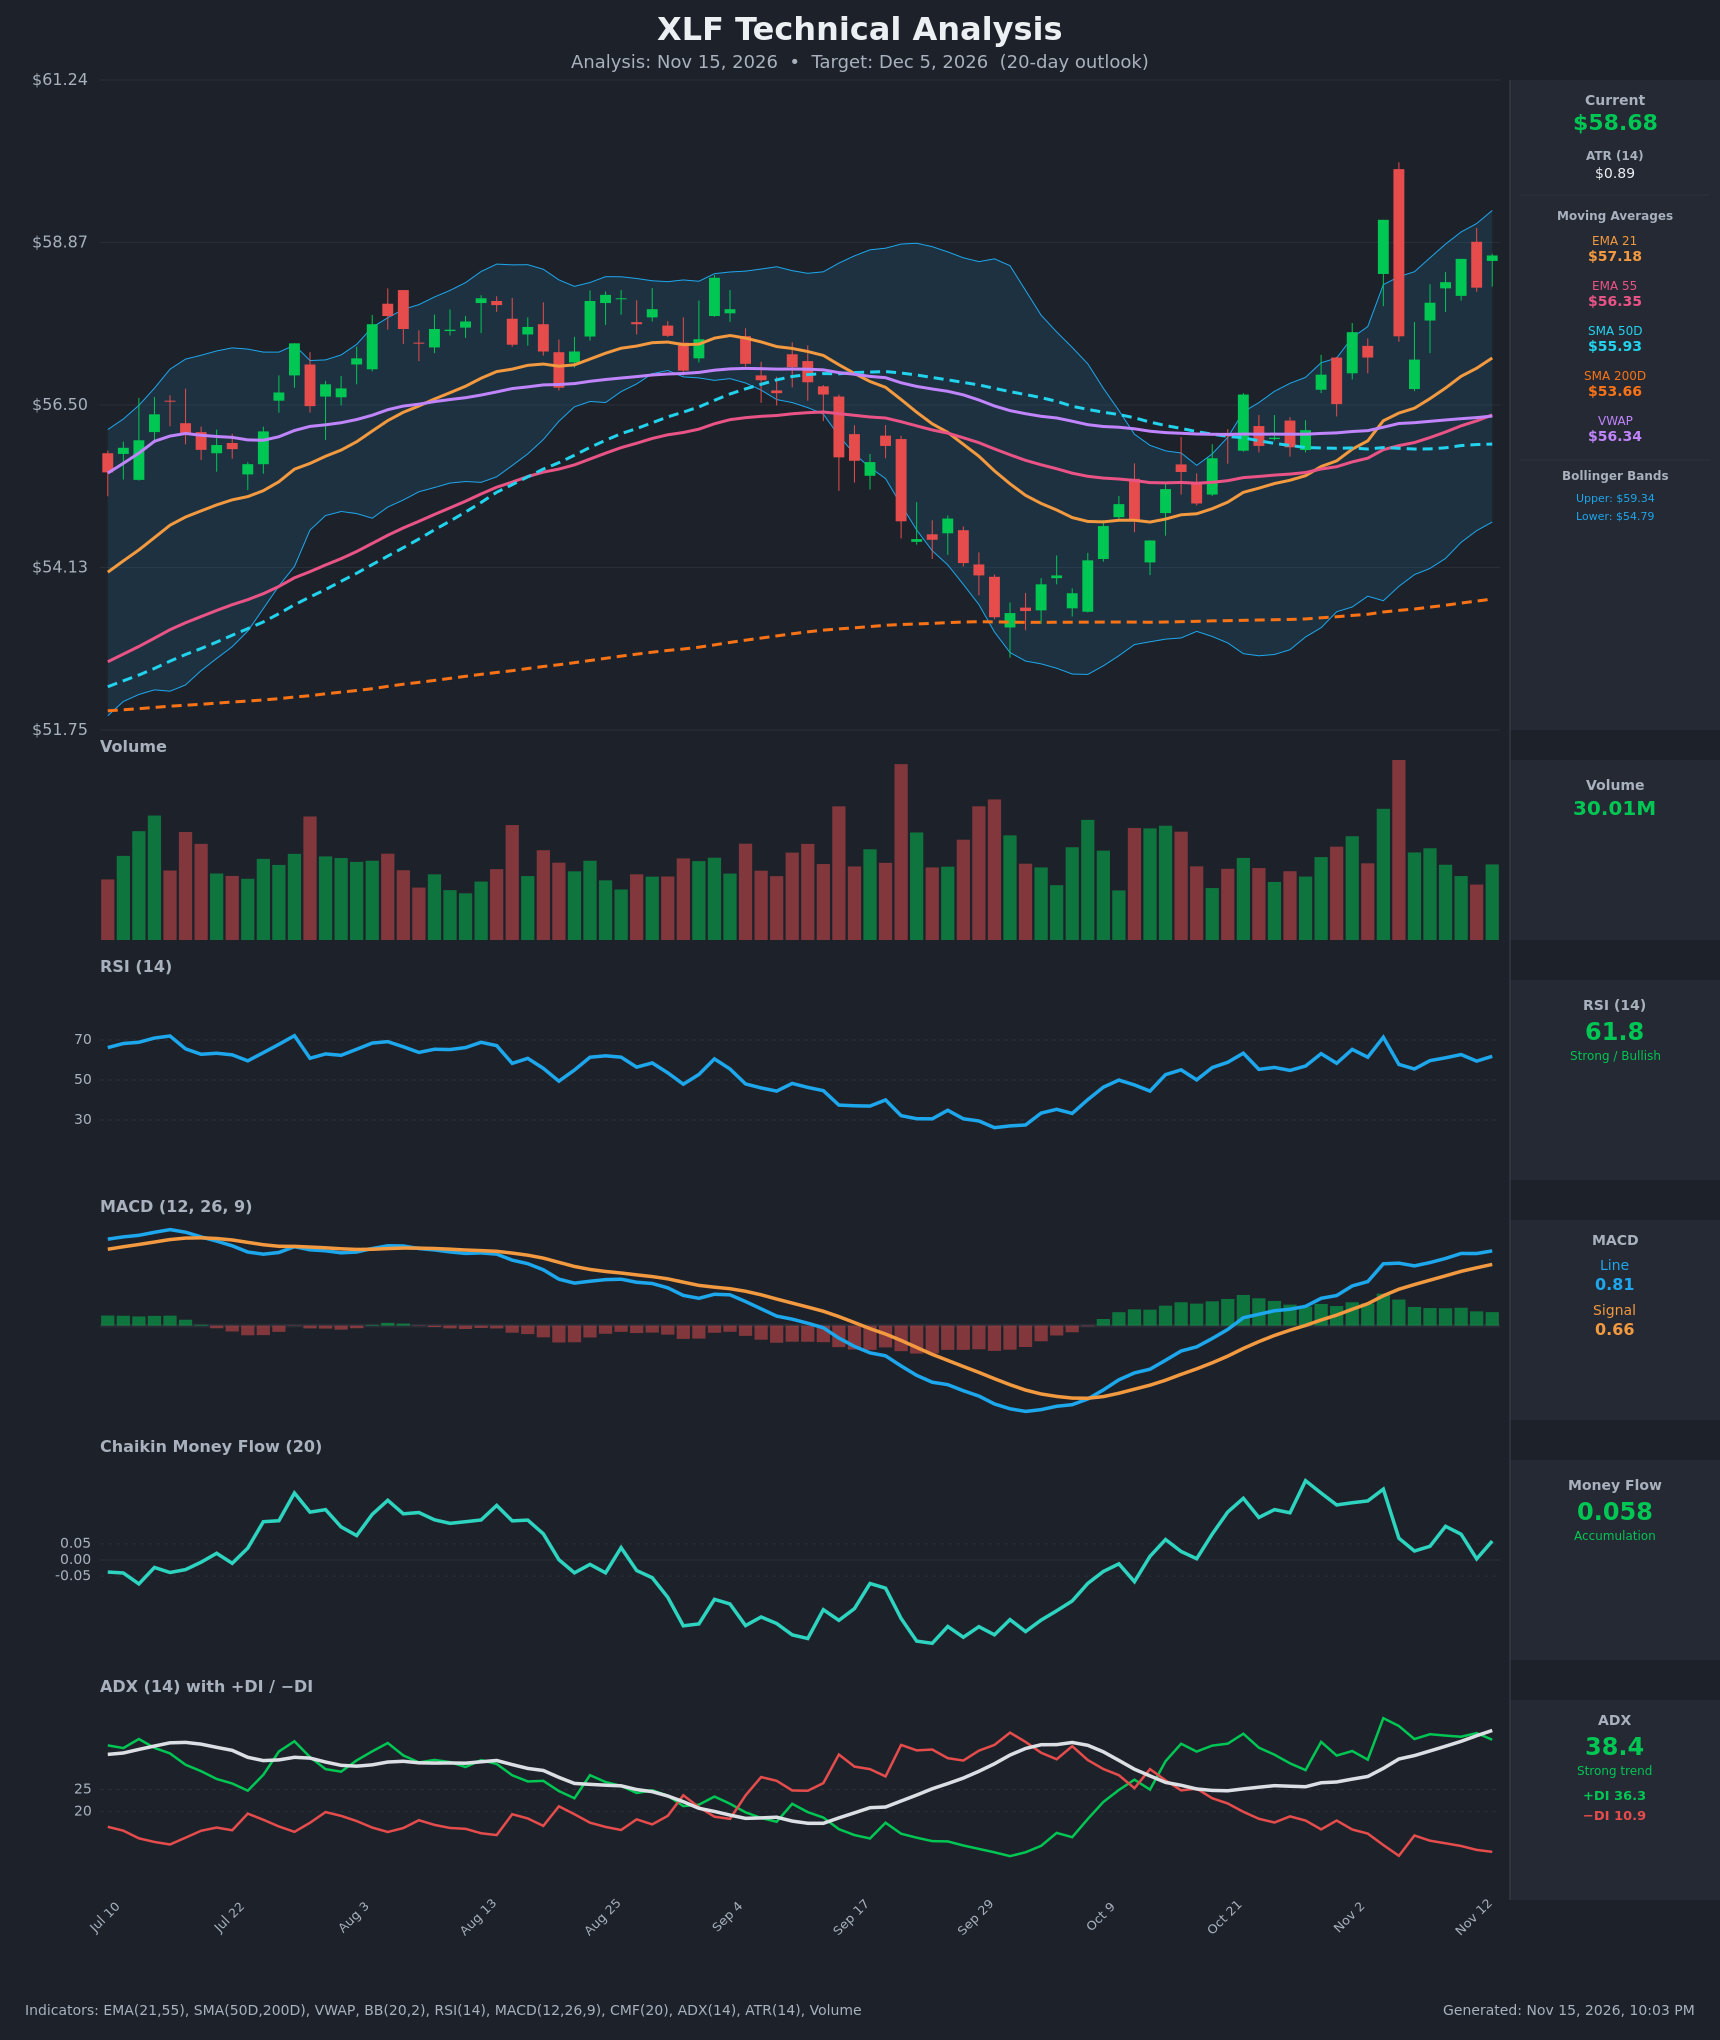
Analysis
TECHNICAL INDICATORS
- RSI (14): 61.84, in bullish territory but below 70. It spiked to 71.4 on Nov 4 and has held mostly in the 55-63 range since, so momentum is firm without being stretched. [Bullish]
- 20 EMA: The supplied value is the EMA 21 at $57.18. Price ($58.68) is about 2.6% above it and the EMA is rising steeply (55.35 → 57.18 in 15 bars). It is the first dynamic support on a pullback. EMA21 is also above EMA55 ($56.35) and price is above VWAP ($56.34) and both SMAs (50D $55.93, 200D $53.66). [Bullish]
- MACD: Line 0.81 is above signal 0.66, both are positive and rising, and the histogram is positive. The line has been above the signal since Oct 28 with no sign of rolling over. [Bullish]
- Bollinger Bands (20): Upper $59.34, lower $54.79, with price at $58.68 in the upper quarter of the band. The bands have expanded after the early-November move. Price is walking the upper half rather than reversing, but the Nov 4 spike to $59.20 was rejected near the upper band. [Bullish]
- CMF (20): 0.058, just above the +0.05 accumulation threshold. It has faded from the 0.15-0.25 area in late October and touched 0.004 on Nov 12, so buying pressure is weakening even as price rises. [Accumulation]
- ADX (14): 38.4 and rising steadily, with +DI 36.3 far above −DI 10.9. This is a strong, mature uptrend with bulls firmly in control. An ADX this high can signal some trend exhaustion risk, but there is no DI crossover. [Strong Trend – Bullish]
- Volume: 30.01M on the latest bar, roughly average. The heavy-volume bar of the period was the Nov 4 red reversal candle. Recent up days have moderate volume with no climactic expansion. [Neutral to mildly Bullish]
DIVERGENCES & TRENDS
- CMF vs. price: Price is making higher highs and highs near $59, while CMF peaked in late October and is lower now. This is a mild bearish divergence in money flow, though CMF is still positive.
- RSI and MACD: Both confirm the price advance. RSI is below its Nov 4 peak even though price closed at the same level, which suggests momentum is steadier rather than accelerating.
- Trend structure: There is a clear sequence from the Sep 29 low near $53.5. Price reclaimed the EMA55 and SMA50D, then the EMA21, and now trades above all of them.
- Crossovers:
- The golden cross (SMA50D above SMA200D) is long established.
- EMA21 crossed above EMA55 in late October/early November.
- MACD crossed above its signal on Oct 28.
- +DI has been above −DI throughout, with the gap widening to 25 points.
- Wick rejection: The Nov 4 spike to $59.20 followed by a drop to $57.50 marks a resistance zone at $59.2-59.4.
CHART PATTERNS
- Ascending Triangle / bull flag-type consolidation (continuation): Price is pressing against flat resistance at about $59.2-59.4 (the Nov 4 high and upper Bollinger Band) with a series of higher lows ($57.16 → $57.99 → $58.21). A close above $59.4 would trigger the breakout. The measured move is the pattern height (about $2.0-2.5) added to the breakout, which points to roughly $61-61.5. This is the second-best fit after a simple trend pause.
- Bearish double-top risk: If price fails at $59.2-59.4 again, the Nov 4 and upcoming highs would form a Bearish Double Top. The neckline is near $57.2 (EMA21 and the Nov 6 low). This is the main risk pattern but it is not confirmed.
POTENTIAL SCENARIOS
- Scenario 1: Bullish Breakout and Trend Continuation — Price clears the $59.2-59.4 resistance and extends the trend, supported by ADX above 35, rising MACD and a wide +DI/−DI gap. Trigger: daily close above $59.40, ideally on above-average volume. Target: $60.50-61.30 (measured move and the top of the chart range). Invalidation: close back below $57.18 (EMA21). (55% probability)
- Scenario 2: Neutral Consolidation Then Resumption — Price stalls beneath resistance, pulls back to the EMA21 and VWAP-to-EMA zone at $57.2-58.0 while CMF resets, then drifts higher into the end of the window. Trigger: rejection at $59.2-59.4 with a low-volume pullback. Target: $57.50-59.00 range. Invalidation: a decisive break above $59.40 (shifts to Scenario 1) or below $56.35 (shifts to Scenario 3). (30% probability)
- Scenario 3: Bearish Double-Top Reversal — A failure at resistance with deteriorating CMF triggers a deeper correction. Trigger: close below $57.18 followed by a break of $56.35 (EMA55) and VWAP. Target: $55.90-56.30 (SMA50D/EMA55). Invalidation: close back above $58.70 after the breakdown. (15% probability)
PRICE TARGETS
- Target Price: $59.80 (20-day horizon, Dec 5, 2026)
- Expected Range: $55.70 to $61.30. Width is $5.60, about 9.5% of the current price, which fits the 14-21 day guidance of 8-12%.
- Key Levels: Support at $57.18 (EMA21), Resistance at $59.34 (upper Bollinger Band and Nov 4 high zone)
OVERALL BIAS
OVERALL BIAS: BULLISH - ADX of 38.4 with +DI far above −DI, price above every moving average, a rising MACD above its signal, and a healthy RSI of 61.8 point to a trend that is more likely to resolve upward through the $59.3 resistance. The main caveat is fading CMF and the Nov 4 rejection near that level, which could produce a pullback toward the EMA21 first.
This is educational analysis and not financial advice.