XLF 34-day bullish forecast — Nov 15, 2026
- Bias: Bullish
- Timeframe: 34 days (made Nov 15, 2026, target date Dec 18, 2026)
- Price at analysis: $58.68
- Price target: $60.40
- Expected range: $55.50 – $63.70
- Result: Pending — graded after the close on Dec 18, 2026
Get a free AI analysis of XLF today
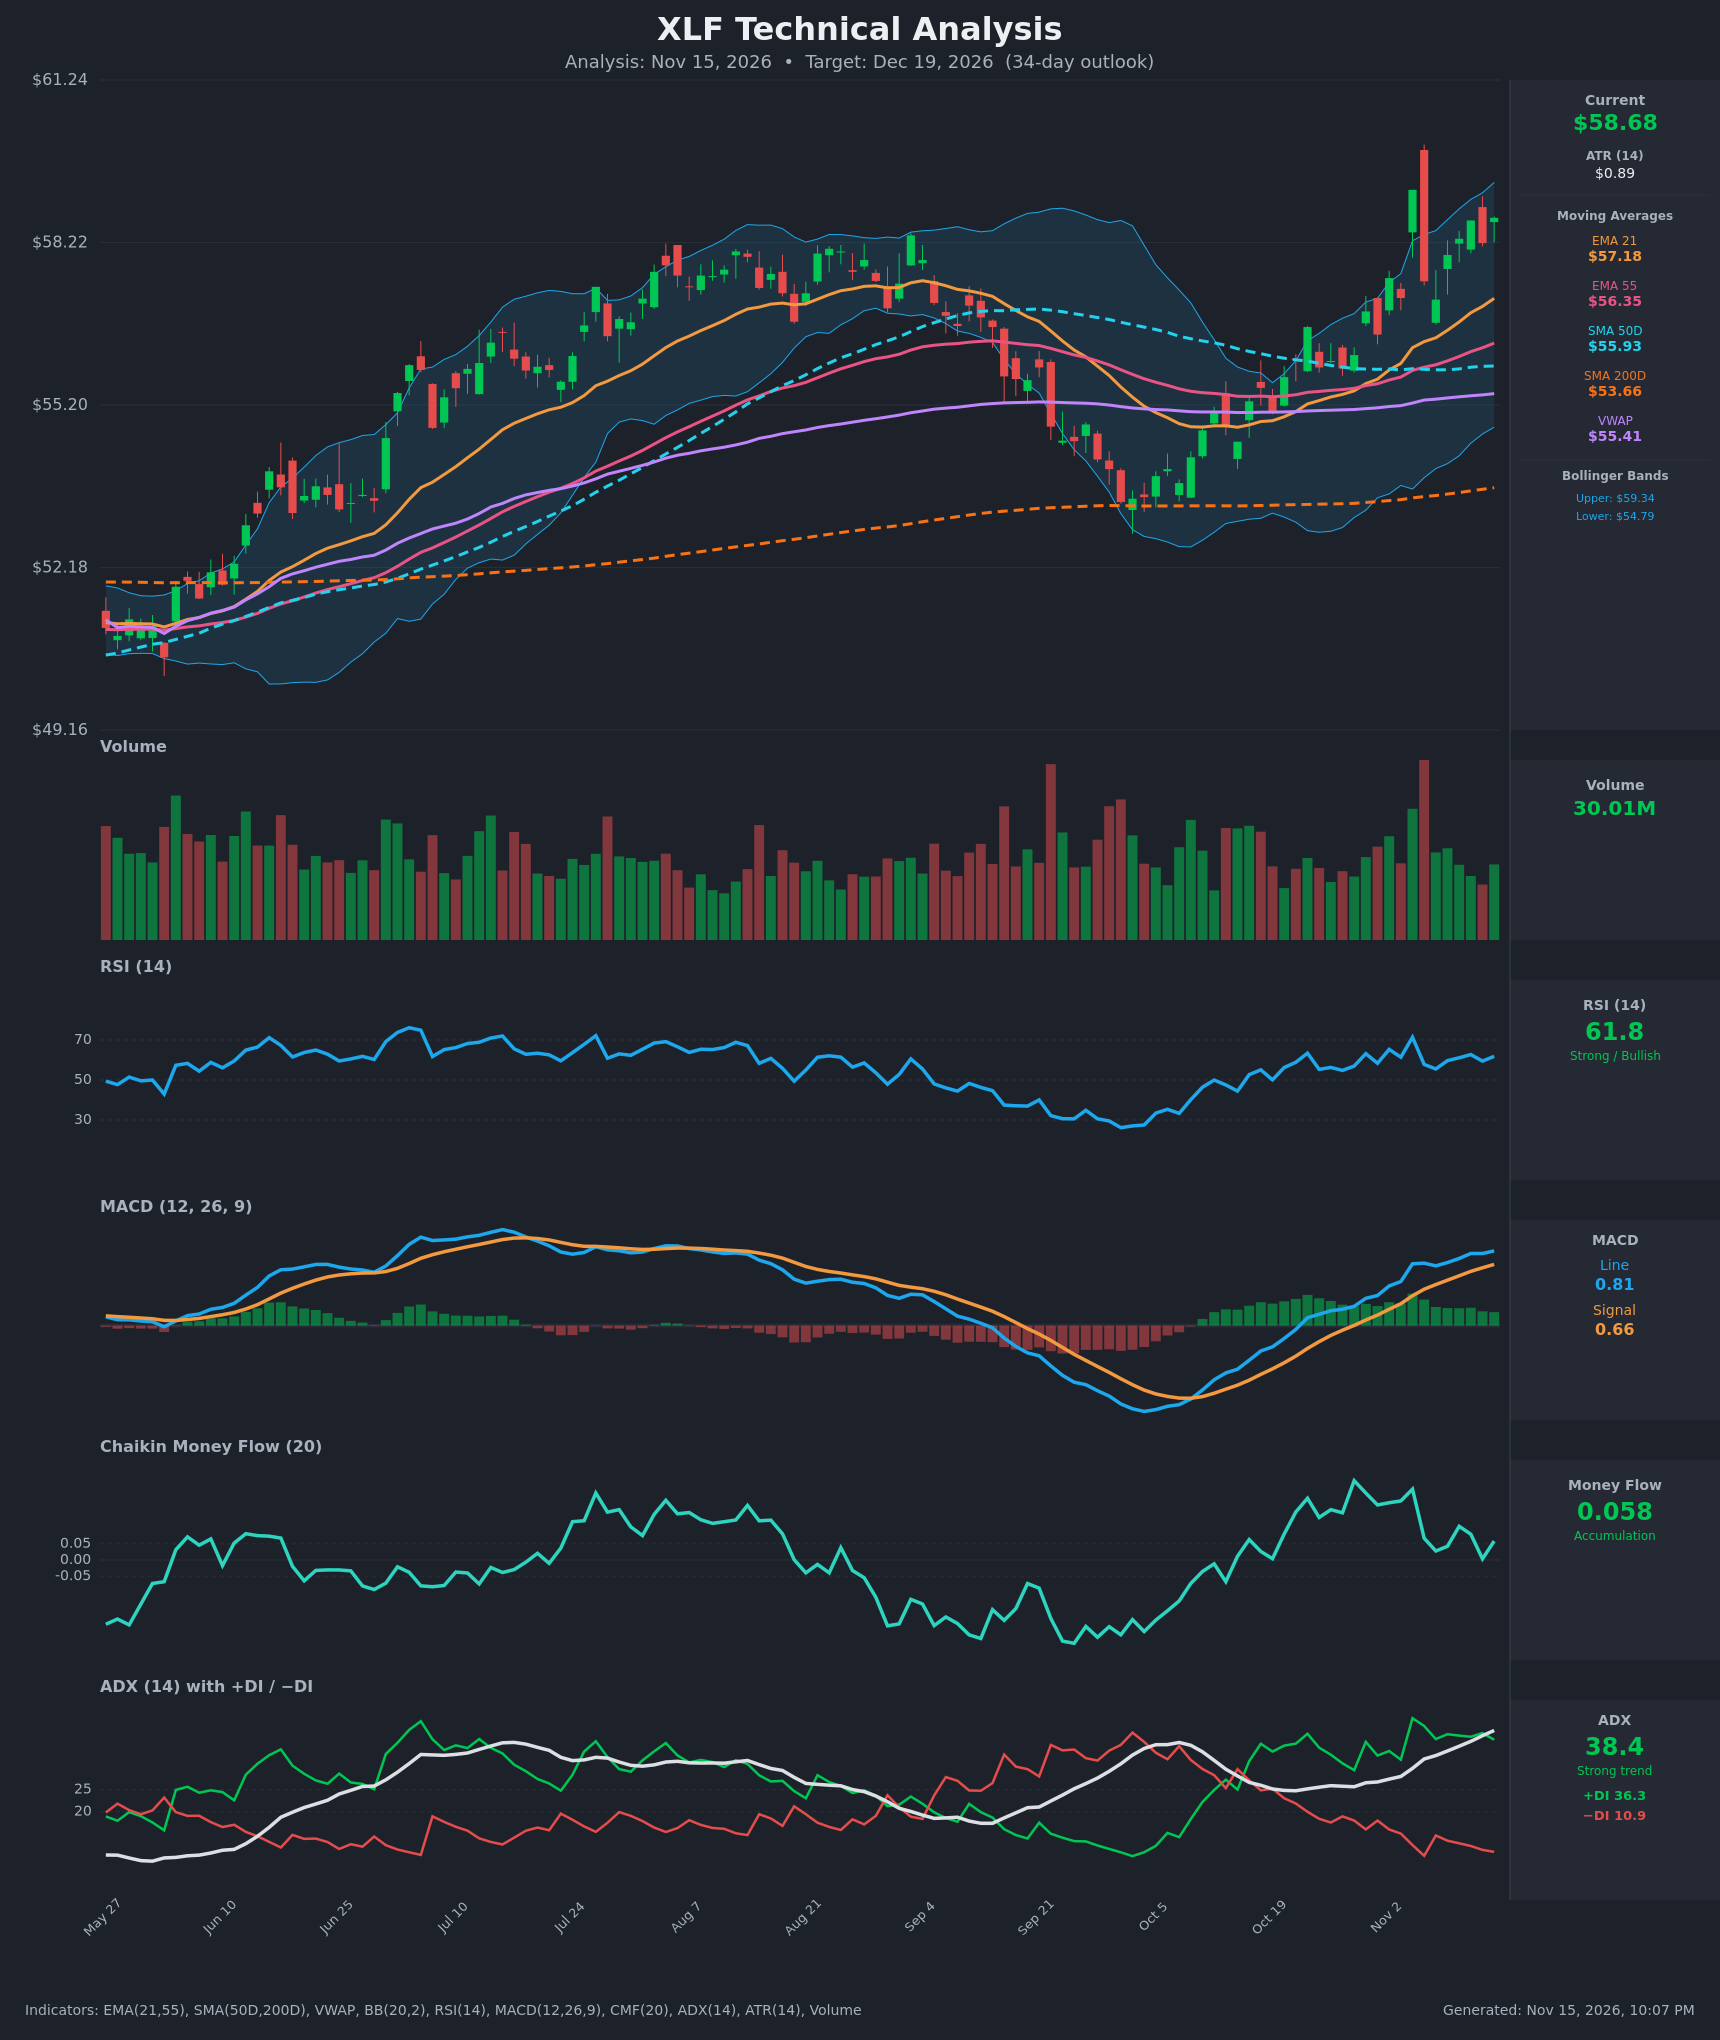
Analysis
TECHNICAL INDICATORS
- RSI (14): 61.84, in the upper-neutral/bullish zone and below overbought. It peaked at 71.4 on Nov 4 and has held the 55-63 range since, so momentum is firm without being stretched. [Bullish]
- 20 EMA: The supplied value is the EMA 21 at $57.18, and price at $58.68 is about 2.6% above it. The EMA 21 sits above the EMA 55 ($56.35) and has been rising steadily, so it is the first dynamic support on pullbacks. [Bullish]
- MACD: Line 0.806 is above signal 0.660, with a positive histogram of about +0.15. The bullish crossover happened in mid-October, and both lines are above zero and rising. The histogram has flattened a little, so acceleration is slowing. [Bullish]
- Bollinger Bands (20): Upper $59.34, lower $54.79, with price at roughly 86% of the band width, close to the upper band. The bands are widening after the breakout from the October squeeze. Price is walking the upper half, which is a trend-strength sign rather than a sell signal on its own. [Bullish]
- CMF (20): 0.058, barely above the +0.05 accumulation threshold. It has faded from highs near 0.25 and dipped to about 0.004 on Nov 12. Buying pressure is positive but weakening, and it is lagging price. [Accumulation]
- ADX (14): 38.4 and rising, with +DI 36.3 far above −DI 10.9. This is a strong, established uptrend with bulls firmly in control. ADX above 35 can also signal a mature trend that is prone to pauses. [Strong Trend + Bullish]
- Volume: 30.01M, about average. The highest recent volume was on the Nov 4 spike, which printed a long upper wick and a red candle (a rejection at about $59.2-$60). Volume on the subsequent up days has been modest, so participation is adequate but not surging. [Neutral to mildly Bullish]
DIVERGENCES & TRENDS
- Mild CMF divergence: Price is near its recent high, but CMF is far below its late-October peak. This suggests less conviction behind the latest advance.
- No RSI divergence: RSI is lower than at the Nov 4 peak (71.4), but price is only slightly below that close. This is not a meaningful divergence.
- MA alignment is fully bullish: Price ($58.68) > EMA 21 ($57.18) > EMA 55 ($56.35) > SMA 50D ($55.93) > SMA 200D ($53.66). The SMA 50D is already above the SMA 200D, so the golden cross is in place and price is in a long-term uptrend.
- Price is above VWAP ($55.41): This indicates sustained buyer control.
- MACD and ADX trends: MACD has been rising since the late-September trough. ADX has climbed from about 26 to 38 in two weeks, and −DI is near its lows.
- Recent breakout: The late-October move through the SMA 50D and the prior swing highs was a clear trend reversal from the Sep-Oct low of about $53.3.
CHART PATTERNS
- Bullish base / reversal (reference: Bullish Double Bottom / rounded recovery): The Sep-Oct low near $53.3 was followed by a higher-low sequence and a breakout above the $56-$57 resistance zone. That measured move supports continuation toward the high $50s and low $60s.
- Bullish flag/pennant-like consolidation (reference: Bullish Flag Pattern / Bullish Pennant): After the sharp Nov 4 impulse, price is consolidating in a tight range of about $57.2-$59.2 with shallow pullbacks. A break above $59.3-$59.5 targets about $60.5-$61.5. The flagpole from about $56 to $59.2 is roughly $3, which projects to about $61.5 from a $58.5 breakout. I take less than that as a base case.
- Risk pattern (reference: Bearish Double Top): The Nov 4 high near $59.2 (wick higher), if retested and rejected, could form a minor double top. The neckline would be around $57.2, which coincides with the EMA 21.
POTENTIAL SCENARIOS
- Scenario 1: Bullish Trend Continuation / Flag Breakout — Strong ADX and +DI dominance, stacked moving averages, and a positive MACD favor a break of the Nov 4 high and a move toward the upper-$50s/low-$60s. Trigger: close above $59.35 (upper Bollinger Band and Nov 4 close area), ideally on volume above 30M. Target: $60.40 first, with an extension to $61.50. Invalidation: daily close below $57.18 (EMA 21). (55% probability)
- Scenario 2: Neutral Consolidation / Digestion — The ADX is extended and CMF is fading, so price may digest the gains with sideways trade while the EMA 21 catches up. Trigger: repeated failures at $59.3 with support holding at $57.2-$57.5. Target: $57.50-$59.00 range. Invalidation: a close above $59.50 or below $56.35. (25% probability)
- Scenario 3: Bearish Pullback / Double-Top Rejection — A rejection at the Nov 4 highs with weakening CMF drives a deeper retracement toward the EMA 55/SMA 50D cluster. Trigger: daily close below $57.18 with MACD histogram turning negative. Target: $56.00-$55.50 (SMA 50D / VWAP zone). Invalidation: reclaim of $58.70 on a closing basis. (20% probability)
PRICE TARGETS
- Target Price: $60.40 (34-day horizon, about +2.9% from $58.68)
- Expected Range: $55.50 to $63.70 (width $8.20, about 14.0% of current price, in line with the 12-18% guidance for 30-60 days)
- Key Levels: Support at $57.18 (EMA 21; next at $56.35 EMA 55 and $55.93 SMA 50D), Resistance at $59.34 (upper Bollinger Band / Nov 4 high area; next at about $60.50)
OVERALL BIAS
OVERALL BIAS: BULLISH - A strong uptrend (ADX 38.4, +DI 36.3 vs −DI 10.9), fully stacked moving averages with a golden cross in place, a positive MACD above its signal, and price above VWAP all favor continuation. The fading CMF and the proximity to the upper Bollinger Band argue for consolidation risk, so I expect a moderate rather than explosive advance.
This is educational analysis and not financial advice.