XLF 83-day bullish forecast — Nov 15, 2026
- Bias: Bullish
- Timeframe: 83 days (made Nov 15, 2026, target date Feb 5, 2027)
- Price at analysis: $58.68
- Price target: $61.20
- Expected range: $53.80 – $64.80
- Result: Pending — graded after the close on Feb 5, 2027
Get a free AI analysis of XLF today
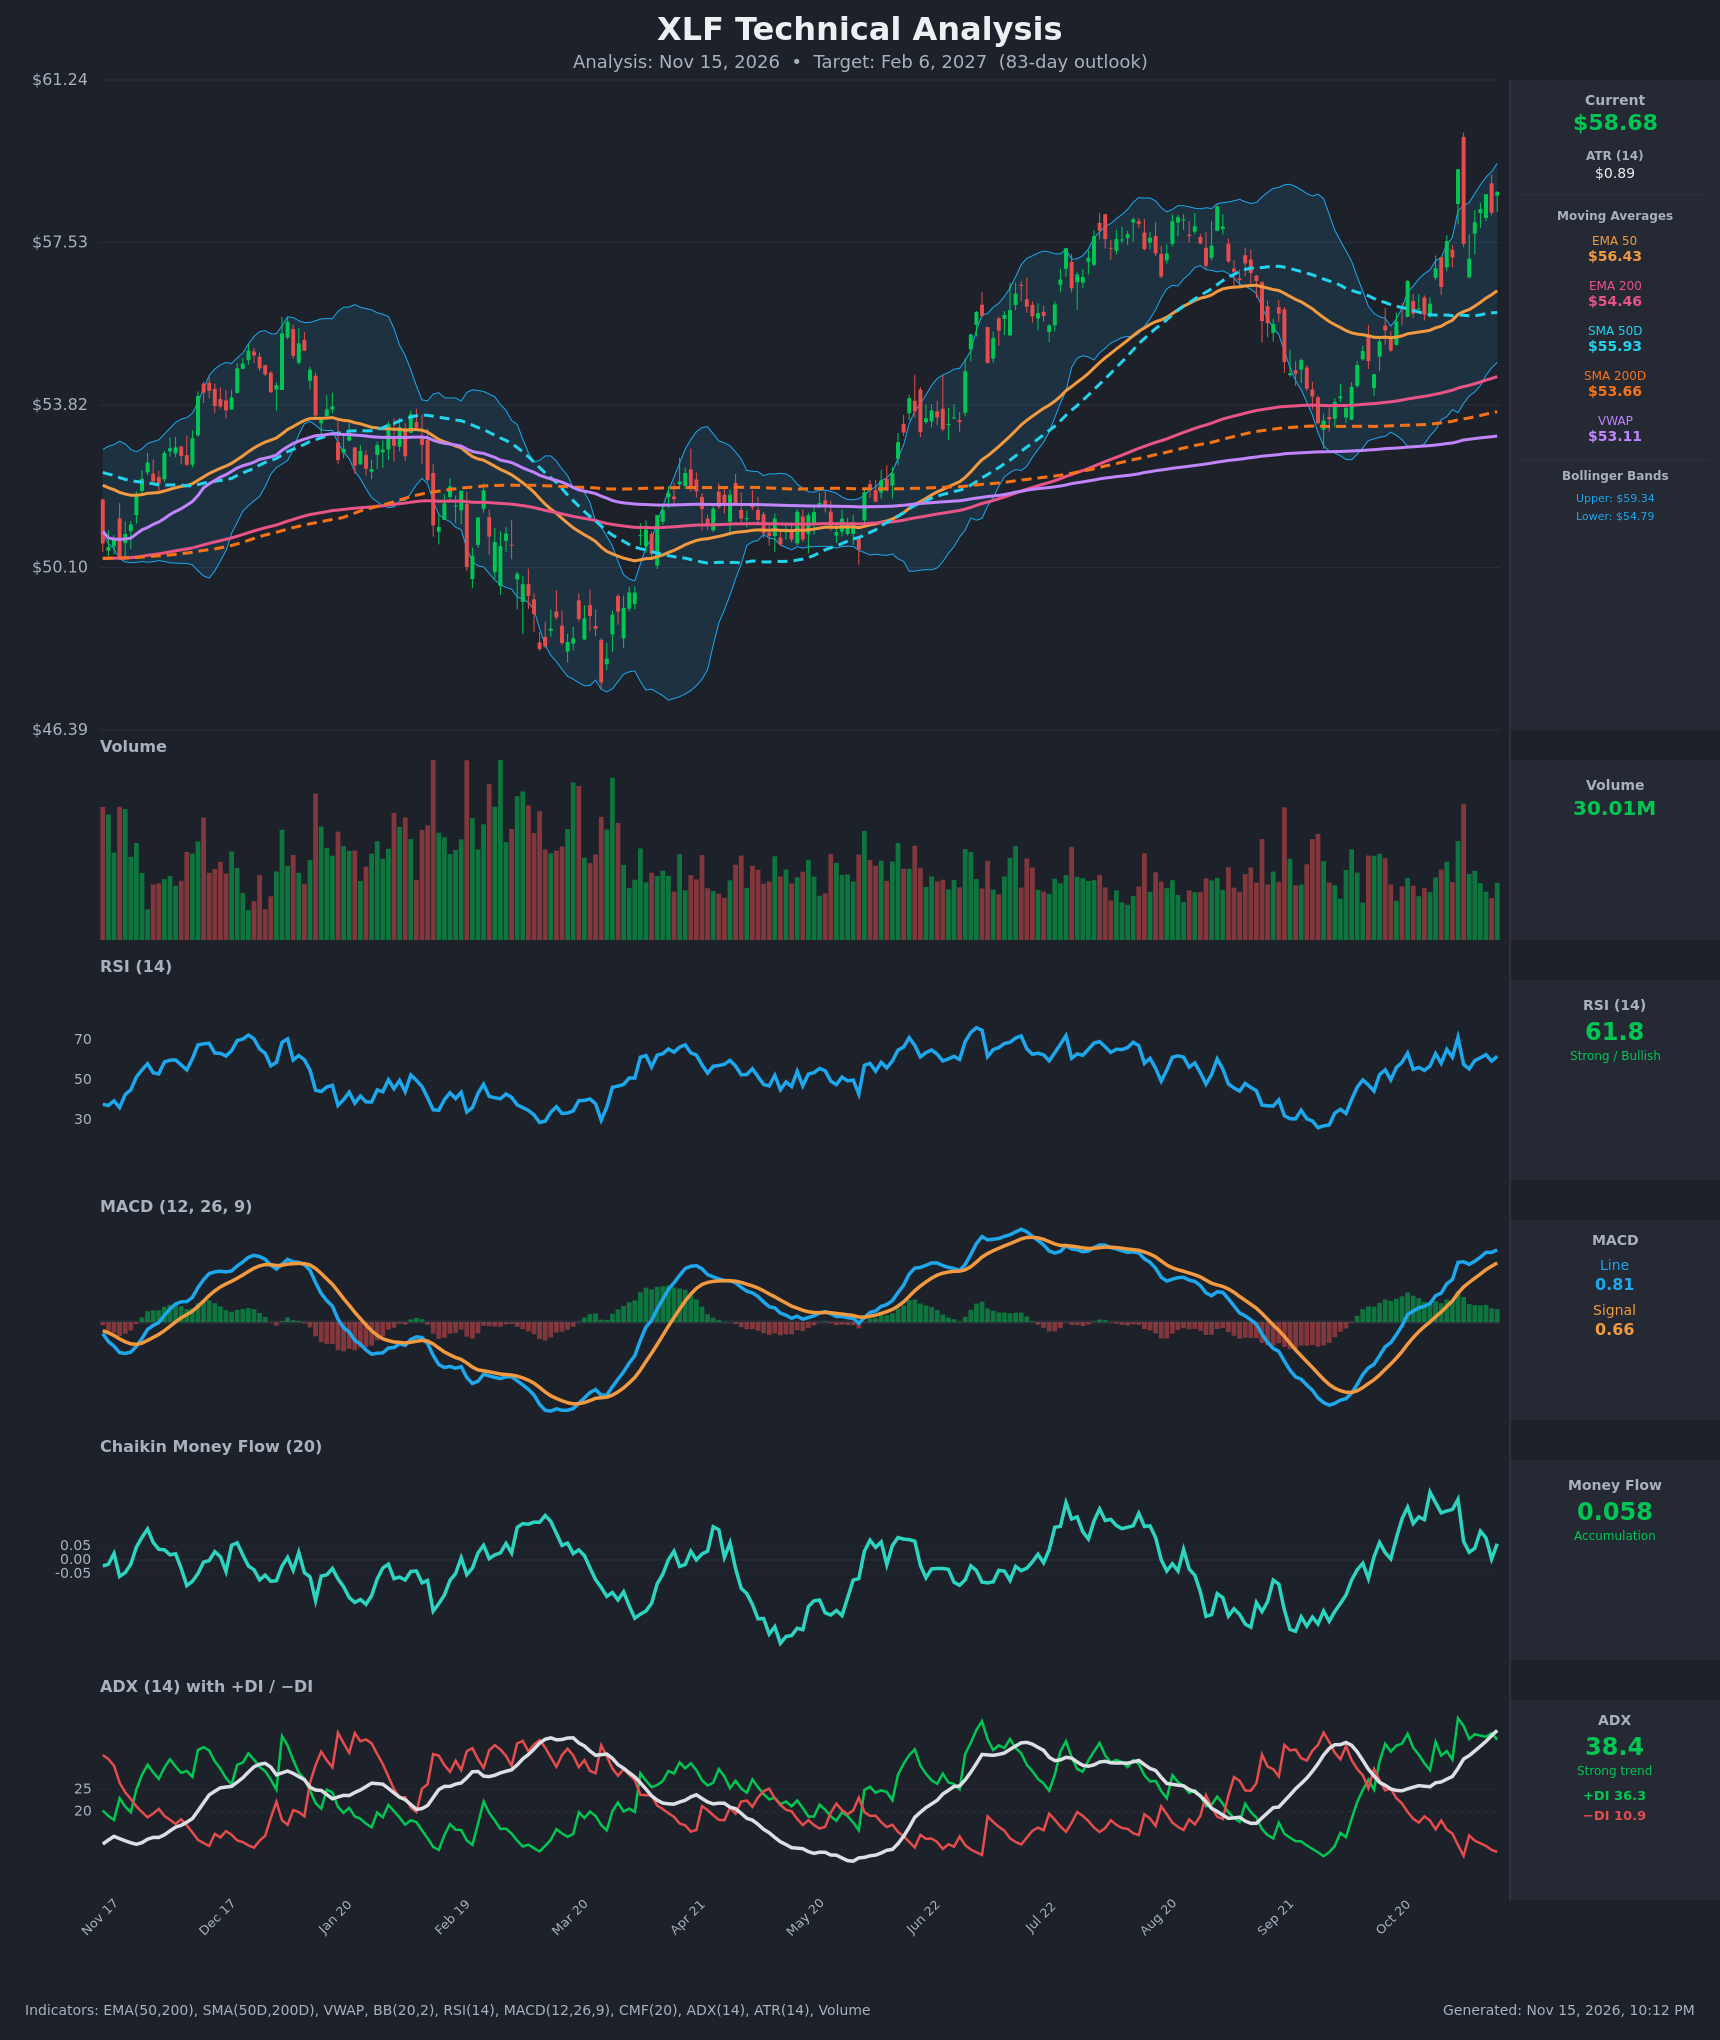
Analysis
TECHNICAL INDICATORS
- RSI (14): 61.84, firmly in bullish territory but below 70 overbought. It has held in a 55-65 band over the past two weeks, with a spike to 71.4 on Nov 4. Momentum is healthy with room to run. [Bullish]
- 20 EMA: Not given directly. Price at $58.68 sits well above the EMA 50 ($56.43), and the 20-period midline of the Bollinger Bands is about $57.06, so price is above short-term support. [Bullish]
- MACD: Line 0.806 is above signal 0.660, with a positive histogram of about +0.15. The bullish crossover occurred around Oct 28, and the line has kept rising since. The histogram has flattened a little in recent bars, so momentum is not accelerating. [Bullish]
- Bollinger Bands (20): Upper $59.34, lower $54.79, middle about $57.06. Price is in the upper third of the bands, about $0.66 below the upper band. The Nov 4 spike to $59.20 touched the upper band, and price has been walking the upper half since. Band width is expanding, which fits a trending move. [Bullish]
- CMF (20): 0.058, barely above the +0.05 accumulation threshold. It has faded from 0.245 on Oct 28 and dipped to 0.004 on Nov 12, so buying pressure is modest and weakening versus the price advance. [Neutral]
- ADX (14): 38.4 and rising, with +DI 36.3 far above −DI 10.9. This is a strong, established uptrend with bulls fully in control. ADX above 35 can signal a mature trend that is prone to pauses. [Strong Trend + Bullish]
- Volume: 30.01M, roughly average to slightly above recent sessions. The Nov 4 reversal-style bar (high, then a pullback) came on elevated volume, but there is no clear distribution. Volume is not confirming the breakout strongly. [Neutral to mildly Bullish]
DIVERGENCES & TRENDS
- Moving averages: Price ($58.68) is above EMA 50 ($56.43), SMA 50D ($55.93), EMA 200 ($54.46), SMA 200D ($53.66) and VWAP ($53.11). Every average is stacked bullishly. EMA 50 crossed above EMA 200 earlier, and SMA 50D is above SMA 200D, so a golden cross is in place and the long-term uptrend is intact.
- CMF vs. price: There is a mild divergence. Price is near its highs, while CMF is far below its late-October peak (~0.245 to 0.058). Accumulation is slowing.
- RSI vs. price: There is no bearish divergence yet. RSI at 61.8 versus 71.4 at the Nov 4 spike shows the Nov 4 high was not exceeded in momentum terms, though price has recovered to near that area.
- MACD: It is trending higher and sits near its recent highs, in line with price.
- ADX/DI: ADX has climbed from about 26 to 38 in two weeks, while −DI collapsed to 10.9. The trend is well established.
- Chart notes: The chart shows a rally from the Sep lows (~$51) to the Nov highs, with a large wick to roughly $60 on Nov 4 that was rejected. The Aug-Sep pullback found support at the 200-day averages.
CHART PATTERNS
- Bullish continuation (ascending channel and bull-flag-like consolidation): The rally from the Sep low into the Nov 4 spike, followed by a tight consolidation of $57-$59, resembles a Bullish Flag Pattern from the reference diagram. A break above ~$59.50 to $60 would project a measured move of about $2.5-$4, toward $62-$63.
- Possible Double Top risk: The prior Jul-Aug high near $58 and the Nov 4 wick near $60 form a loose multi-top zone around $58-$60. A failure to clear $60 and a break below $56.5 would hint at a Bearish Double Top-style reversal toward the 200-day averages near $54-$55. This is the lower-probability read.
- Significance: The breakout above the Jul-Aug highs (~$58) turns that former resistance into support.
POTENTIAL SCENARIOS
- Scenario 1: Bullish Trend Continuation — The strong ADX and fully bullish stack of averages carry price through the $59-$60 resistance zone and higher over the next 83 days, with pullbacks to the EMA 50 area being bought. Trigger: daily close above $59.50 to $60 with expanding volume. Target: $62.50-$64. Invalidation: close below $56.40 (EMA 50). (55% probability)
- Scenario 2: Neutral Consolidation Range — Price stalls beneath the $60 wick high and chops between about $55.50 and $60 as ADX fades from elevated levels and CMF stays near zero. Trigger: repeated rejection at $59-$60 with CMF falling below 0.05. Target: $56-$60 range. Invalidation: close above $60.50 or below $55. (25% probability)
- Scenario 3: Bearish Pullback and Reversal — The Nov 4 rejection wick and the multi-top zone mark a local peak. A MACD bearish crossover and a break below $56.40 open a decline toward the 200-day averages. Trigger: close below $56.40, then below $55.90 (SMA 50D). Target: $53.70-$54.50. Invalidation: reclaim of $58.50. (20% probability)
PRICE TARGETS
- Target Price: $61.20 (83 days, about Feb 6, 2027)
- Expected Range: $54.80 to $64.50 (width $9.70, about 16.5% of current price, within the 61-180 day guidance on the lower end given strong trend and moderate ATR)
- Key Levels: Support at $56.43 (EMA 50, with $55.93 SMA 50D beneath), Resistance at $60.00 (Nov 4 wick high zone)
Self-check: the width of $9.70 is 16.5% of $58.68. For an 83-day horizon the guidance is ~18-30%, so I am widening the range slightly:
- Revised Expected Range: $53.80 to $64.80 (width $11.00, about 18.7% of current price)
OVERALL BIAS
OVERALL BIAS: BULLISH - Price is above every moving average with a golden cross intact, ADX at 38 with +DI far above −DI, and a MACD bullish crossover. The main caveats are fading CMF and resistance near $60, so I expect a modest advance to about $61.20 rather than a runaway move.
This is educational analysis and not financial advice.