XLF 48-day bullish forecast — Nov 15, 2026
- Bias: Bullish
- Timeframe: 48 days (made Nov 15, 2026, target date Jan 1, 2027)
- Price at analysis: $58.68
- Price target: $60.40
- Expected range: $55.60 – $63.60
- Result: Pending — graded after the close on Jan 1, 2027
Get a free AI analysis of XLF today
Analysis
TECHNICAL INDICATORS
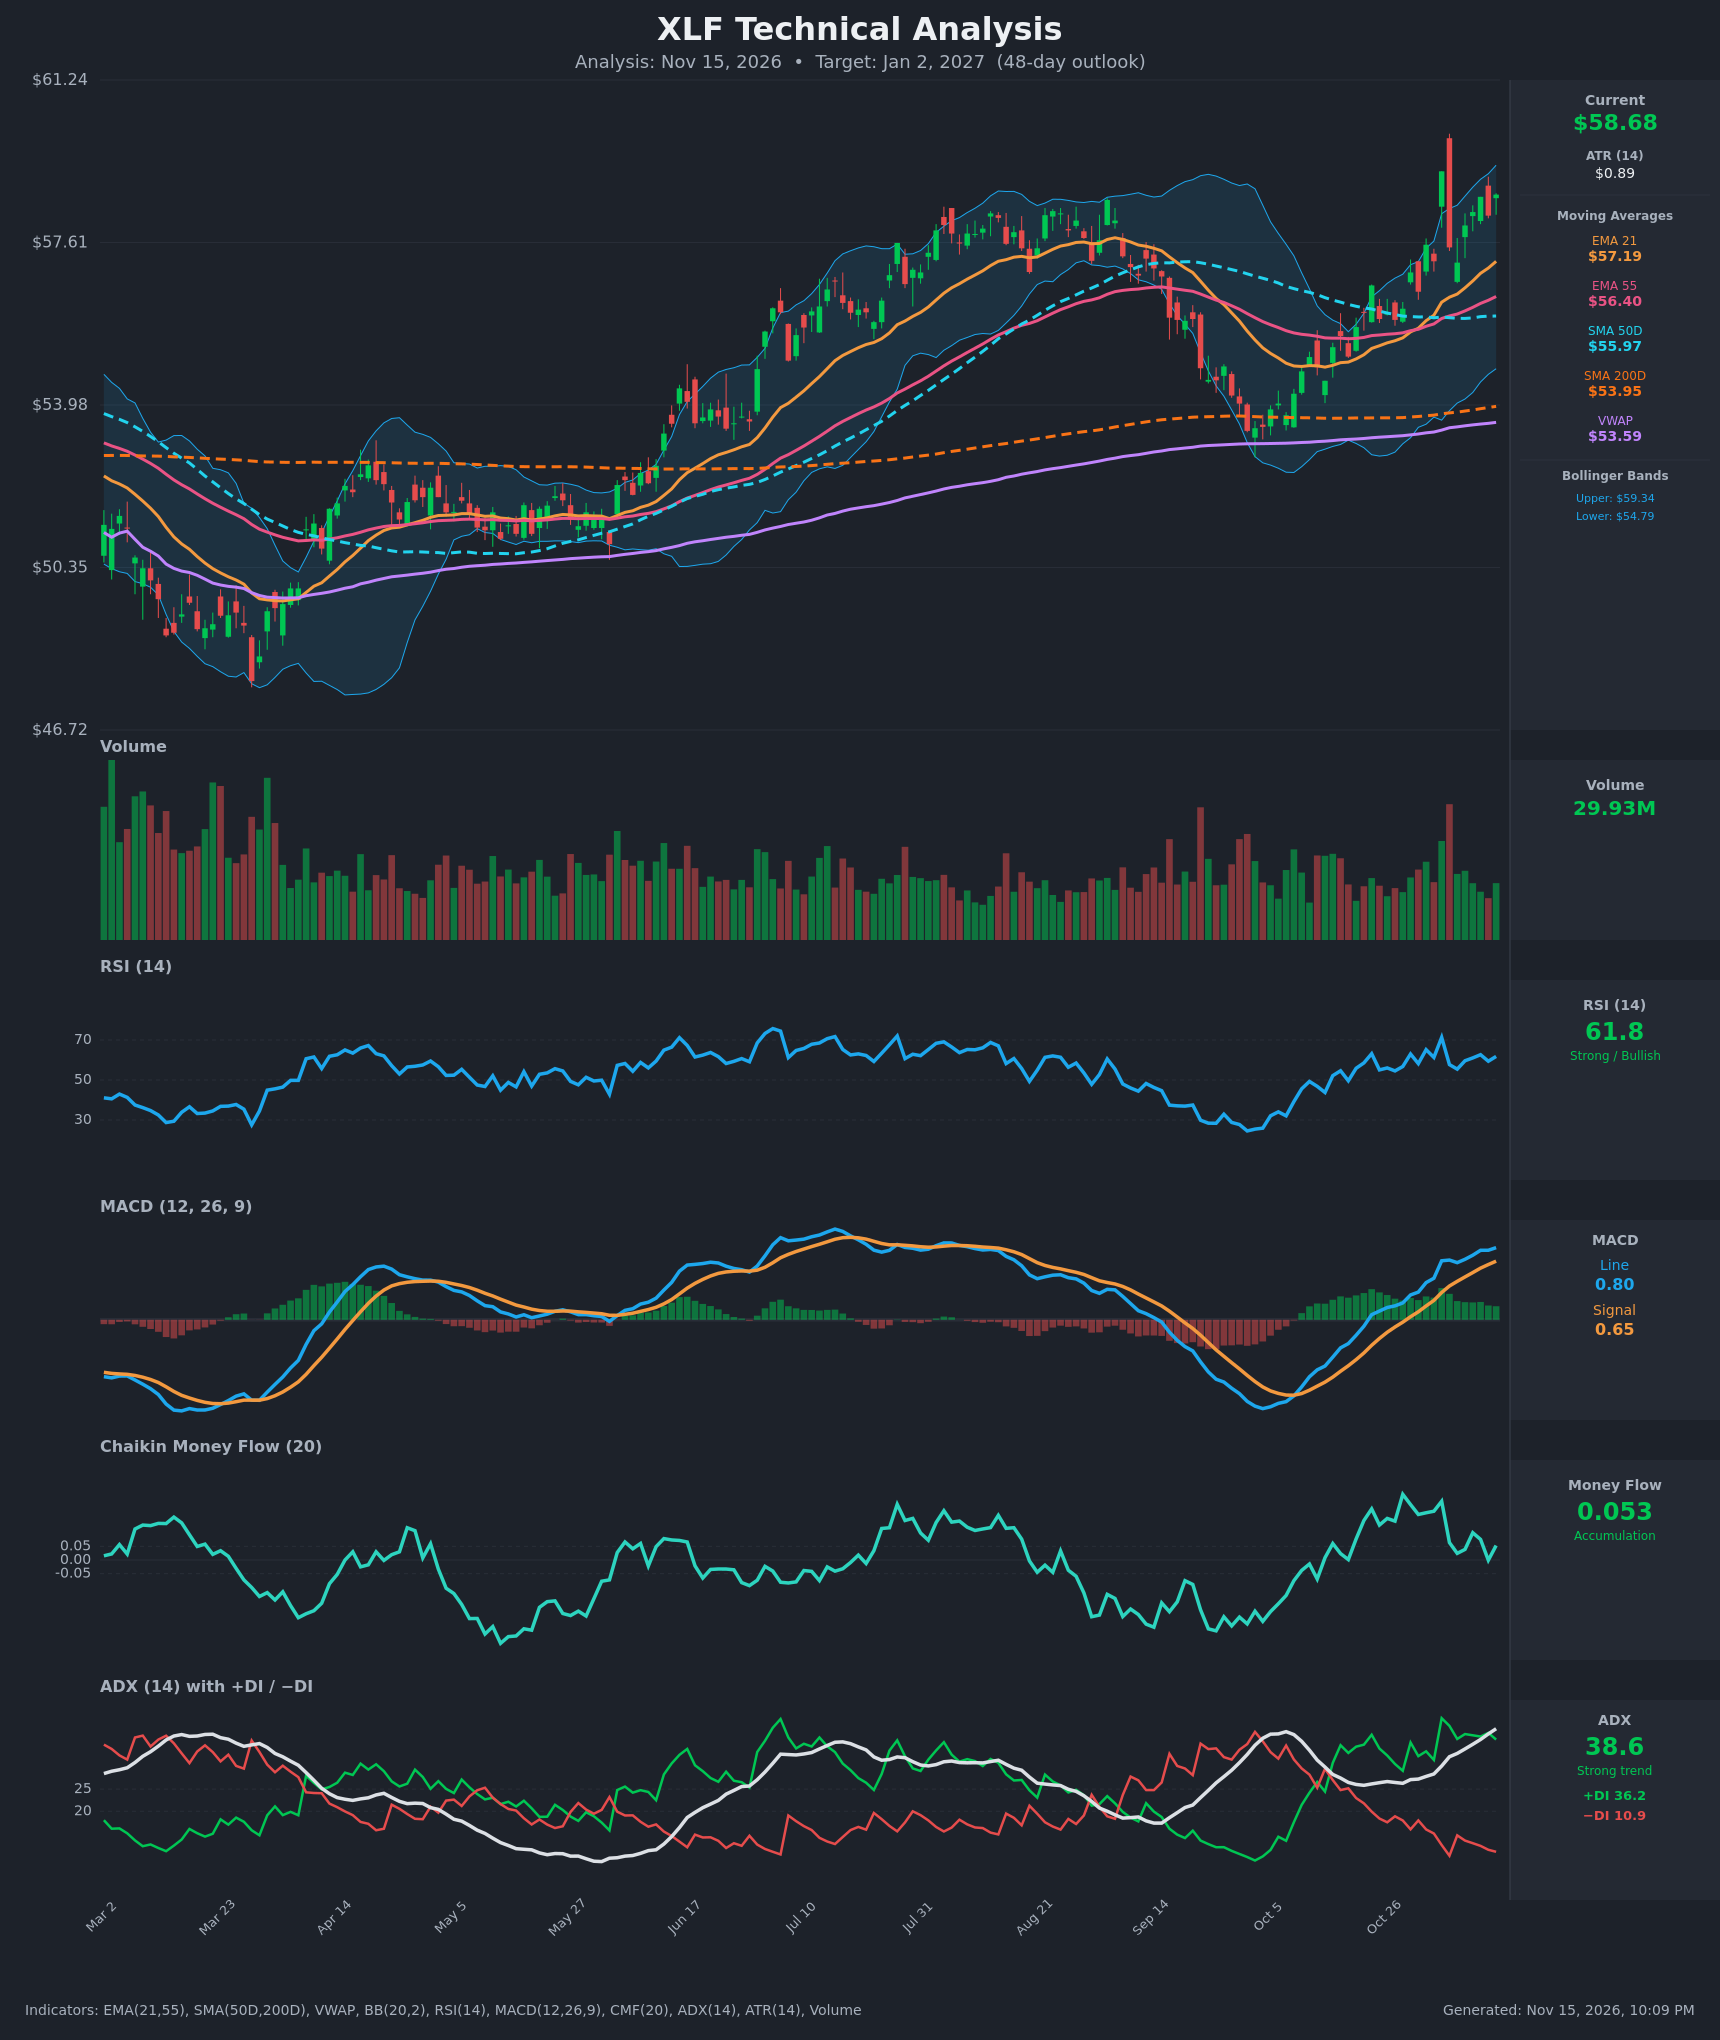
- RSI (14): 61.79, in the bullish zone and below overbought (70). It spiked to 71.3 on Nov 4, pulled back to the mid-50s, and has recovered to the low 60s. Momentum is firm but not stretched. [Bullish]
- 20 EMA: The 21 EMA is $57.19 and price ($58.68) is about 2.6% above it. The EMA slope is rising, and it is stacked above the EMA 55 ($56.40), SMA50D ($55.97), SMA200D ($53.95) and VWAP ($53.59). The 21 EMA has acted as dynamic support on pullbacks. [Bullish]
- MACD: The line (0.797) is above the signal (0.647), and both are positive and rising. The histogram is positive at about +0.15. The bullish crossover happened around Oct 29, and the line is making new highs for the move. [Bullish]
- Bollinger Bands (20): Upper $59.34, lower $54.79, midline about $57.06. Price is in the upper quarter of the bands, about $0.66 below the upper band, with no overextension. The bands are expanding after the Nov 4 spike, which is consistent with trend continuation. [Bullish]
- CMF (20): 0.053, barely above the +0.05 accumulation threshold. It has faded from 0.24 in late October and dipped to -0.001 on Nov 12. Buying pressure is weakening and is the softest part of the picture. [Neutral]
- ADX (14): 38.6 and rising, a strong trend. +DI (36.2) is far above −DI (10.9), so bulls control. ADX has risen from 26 to 38.6 over the last 15 bars. [Strong Trend – Bullish]
- Volume: 29.93M, roughly average. The Nov 4 spike to $59.20 came on heavy volume but was fully rejected in the same session, leaving a long upper wick. Recent up days have not shown strong volume expansion. [Neutral to mildly bullish]
DIVERGENCES & TRENDS
- Price is near its recent highs and RSI has not made a new high, since it is 61.8 against 71.3 on Nov 4. This is a mild momentum lag but not a true divergence, because price is still below the Nov 4 intraday spike.
- CMF has declined from about 0.24 to 0.05 while price held up and rose. This is a mild bearish divergence in money flow and a caution for follow-through.
- MACD and ADX are both trending up, confirming trend strength.
- SMA50D ($55.97) is above SMA200D ($53.95), so the golden cross is already in place. Price is above the SMA200D, which signals a long-term uptrend.
- EMA21 is above EMA55, a confirmed bullish alignment. The EMA21–EMA55 spread has widened from near zero on Oct 30 to about $0.79.
- Price has recovered from the September–October low near $52.5 and reclaimed the SMA50D. It is now approaching the July–August highs near $58.
CHART PATTERNS
- Reversal base: From the October low, the decline and recovery resembles a Bullish Double Bottom / rounded recovery that has already broken out, with price back above the prior swing highs near $57.
- Possible Bullish Pennant / Flag: The consolidation after the Nov 4 spike (roughly $57.2–$58.7) looks like a small flag. A break above $59.20–$59.34 would target about $61 (the prior leg's measured move).
- Risk: The Nov 4 long upper wick near $59.2 marks a short-term resistance zone and could become a double top if rejected again. With ADX at 38.6, a top is not yet favored.
POTENTIAL SCENARIOS
- Scenario 1: Bullish Trend Continuation — Strong ADX, positive MACD and a full bullish MA stack favor a breakout above the $59.20 spike high, with pullbacks to the 21 EMA bought. Trigger: daily close above $59.40. Target: $61.00–$62.00. Invalidation: close below $56.90 (21 EMA / flag base). (55% probability)
- Scenario 2: Neutral Consolidation Near Highs — Fading CMF and the rejection at $59.2 produce a range between about $56.5 and $59.5 as the trend digests gains. Trigger: failure to close above $59.40 for several sessions. Target: $57.50–$59.00. Invalidation: close above $59.60 or below $56.40. (25% probability)
- Scenario 3: Bearish Pullback — A failed breakout and a CMF turn negative drive a correction toward the EMA55 and SMA50D. Trigger: close below $57.00 on rising volume. Target: $55.90–$56.40. Invalidation: reclaim of $58.50. (20% probability)
PRICE TARGETS
- Target Price: $60.40 (48-day horizon)
- Expected Range: $55.60 to $63.60 (width $8.00 ≈ 13.6% of current price, consistent with the 30-60 day guidance of 12-18%)
- Key Levels: Support at $57.19 (21 EMA), with deeper support at $56.40 (EMA 55); Resistance at $59.34 (upper Bollinger Band / Nov 4 spike high), then $61.24
OVERALL BIAS
OVERALL BIAS: BULLISH - ADX at 38.6 with +DI far above −DI, a bullish MACD, a full bullish MA stack (golden cross in place, price above all averages) and a series of higher lows favor continuation toward $60+. The fading CMF and the rejection near $59.2 temper conviction and make a pullback to the 21 EMA likely along the way.
This is educational analysis and not financial advice.