XLF 62-day bullish forecast — Nov 15, 2026
- Bias: Bullish
- Timeframe: 62 days (made Nov 15, 2026, target date Jan 15, 2027)
- Price at analysis: $58.68
- Price target: $61.00
- Expected range: $54.50 – $65.00
- Result: Pending — graded after the close on Jan 15, 2027
Get a free AI analysis of XLF today
Analysis
TECHNICAL INDICATORS
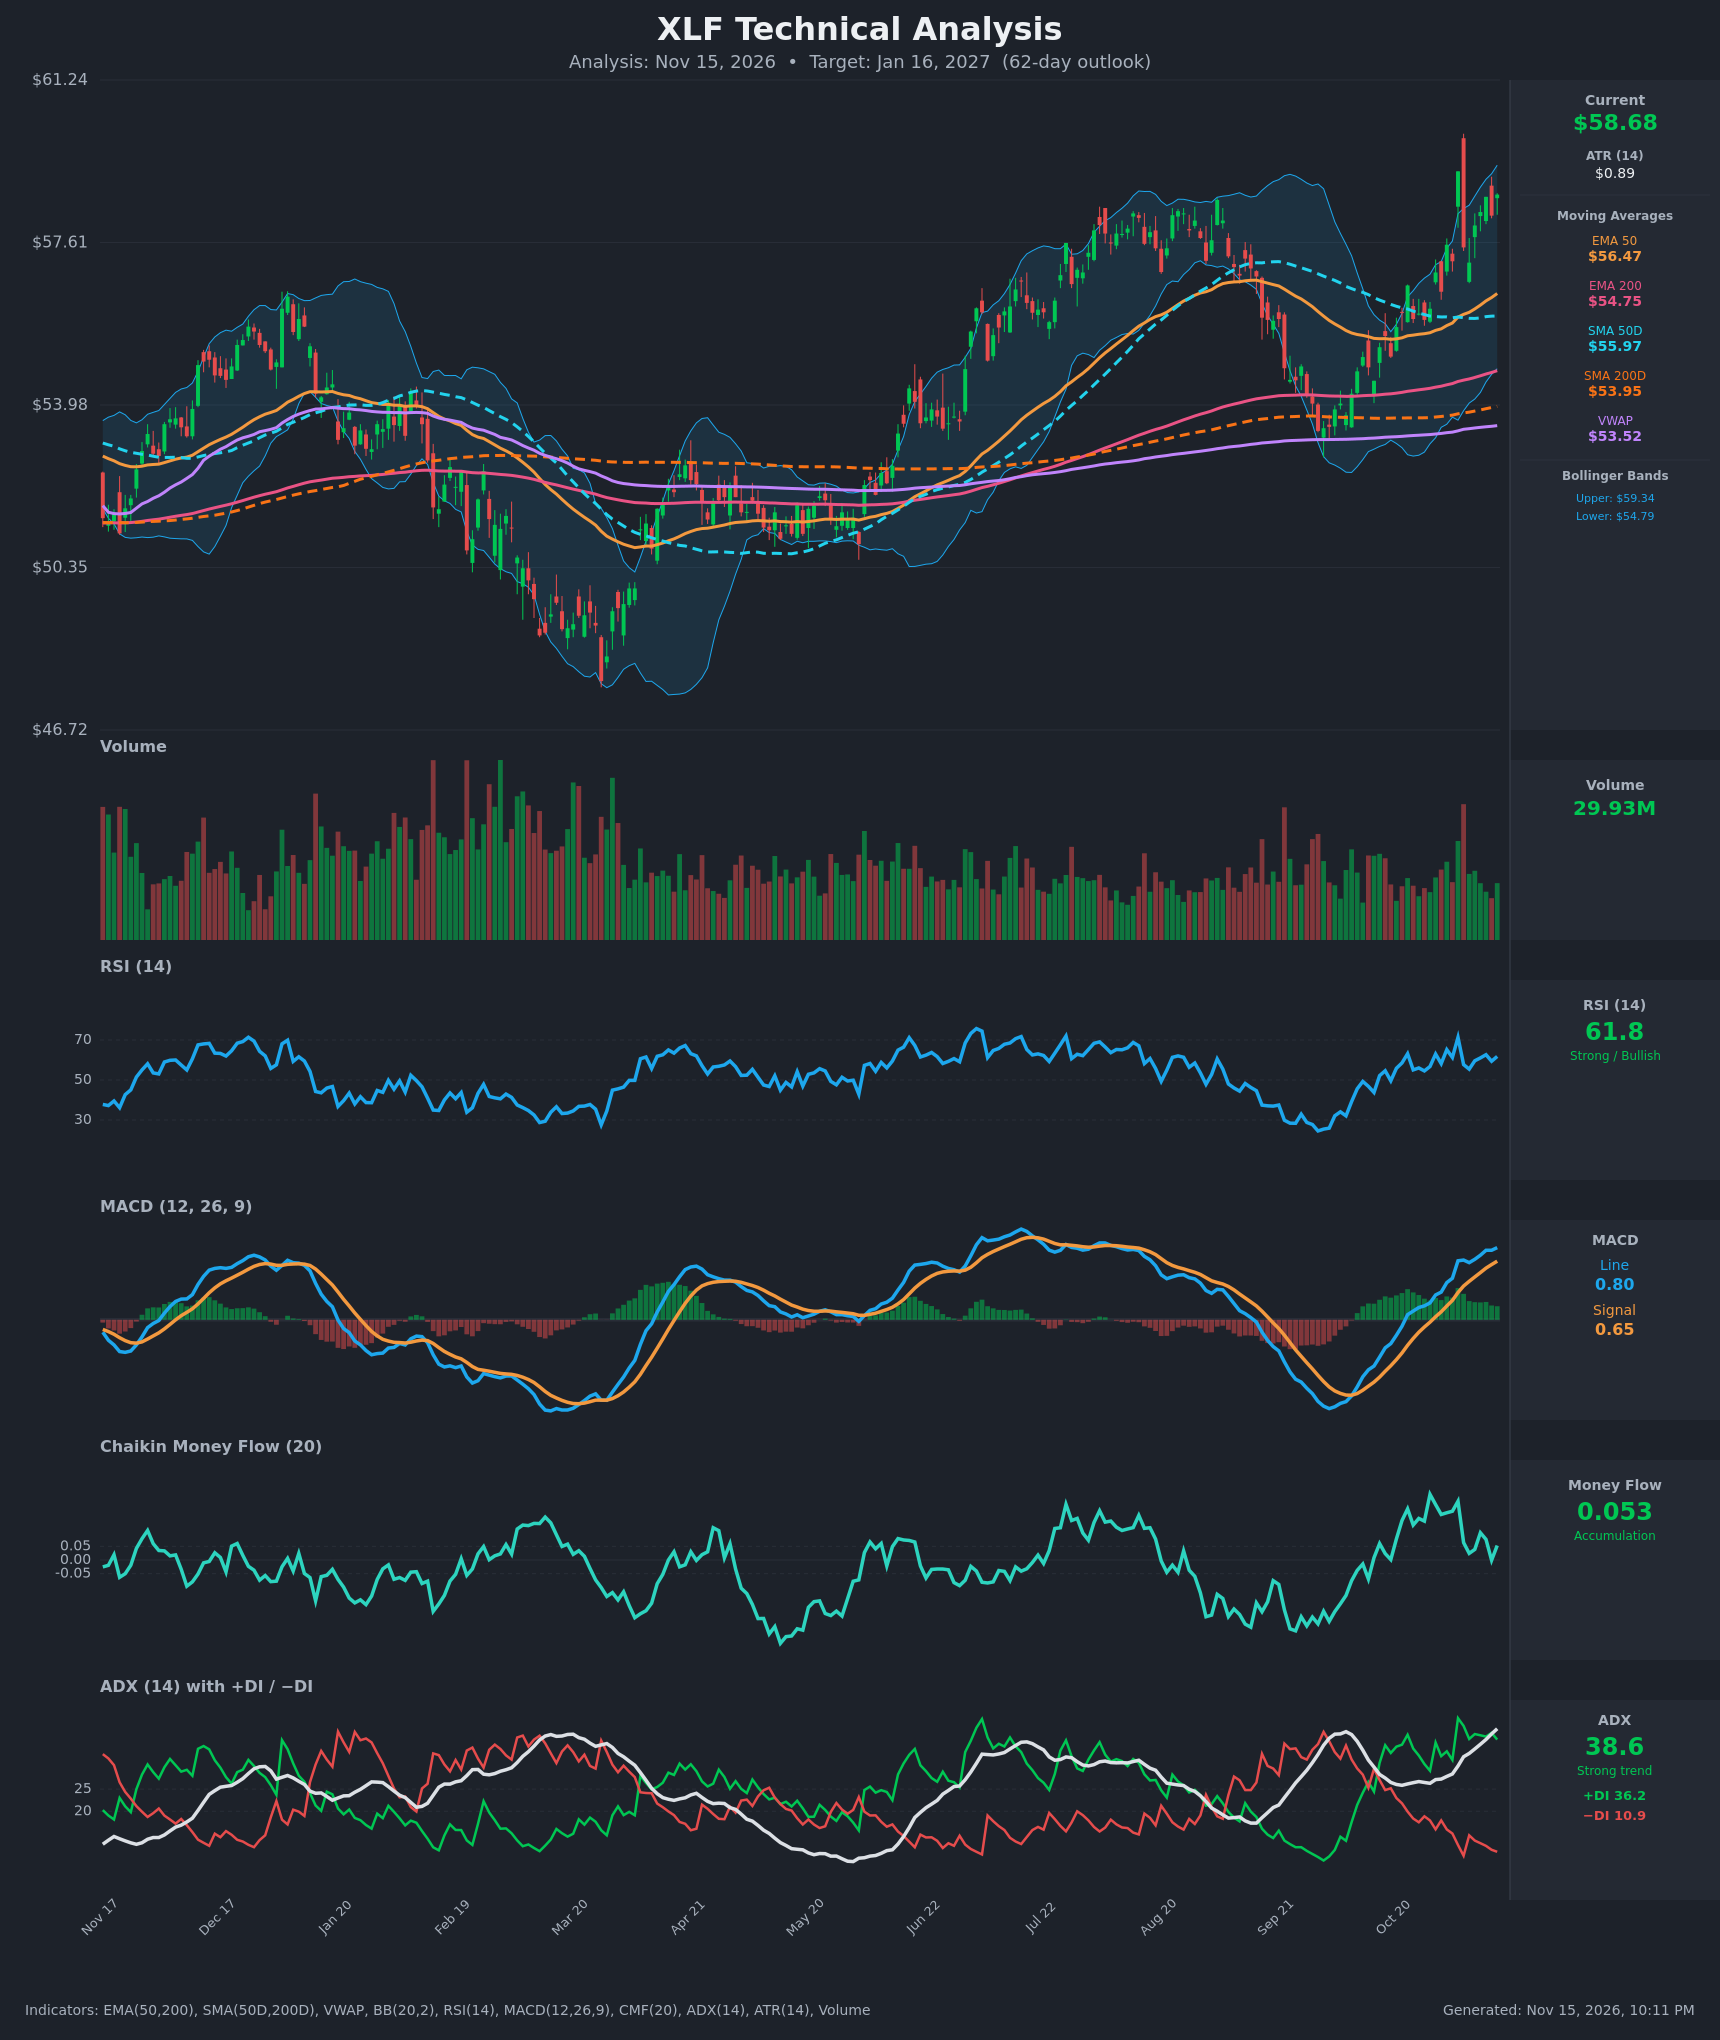
- RSI (14): 61.79, in the bullish zone and below overbought. It spiked to 71.3 on Nov 4 and has since held in the 55–63 range, so momentum is firm but not stretched. [Bullish]
- 20 EMA: The 20 EMA isn't supplied, so I'm using the EMA 50 at $56.47. Price at $58.68 sits about 3.9% above it, and the EMA 50 is rising steadily. It is stacked above the EMA 200 ($54.75), SMA 50D ($55.97) and SMA 200D ($53.95). The EMA 50 is the first dynamic support. [Bullish]
- MACD: The line at 0.797 is above the signal at 0.647, both are positive, and both are rising. The histogram is positive (about +0.15) and has been steady for several sessions. The bullish crossover happened around Oct 29 and is still intact. [Bullish]
- Bollinger Bands (20): Upper $59.34, lower $54.79, midline about $57.06. Price is in the upper quarter of the band, about 1.1% below the upper band, and the bands are widening. The Nov 4 spike to $59.20 touched the upper band and was sold back. This is trend-walking rather than a clear overextension. [Bullish]
- CMF (20): 0.053, just above the +0.05 threshold. It has faded from 0.24 in late October and briefly dipped to -0.001 on Nov 12. Buying pressure is marginal and weakening, which lags the price advance slightly. [Accumulation]
- ADX (14): 38.6 and rising, with +DI at 36.2 and -DI at 10.9. +DI is well above -DI, so this is a strong uptrend. The ADX level itself is high enough that a pause or consolidation is possible. [Strong Trend + Bullish]
- Volume: 29.93M, around average, with a spike on the Nov 4 reversal day. Volume is not expanding on the advance, so participation is only moderate. VWAP at $53.52 is far below price, which shows buyers have been in control. [Neutral-to-Bullish]
DIVERGENCES & TRENDS
- Price is making higher highs near $59, but RSI (61.8) is below its Nov 4 peak (71.3) and CMF is below its late-October level (0.24). This is a mild bearish divergence in momentum and money flow, and it hints at near-term consolidation rather than a reversal.
- MACD, ADX and DI readings are all rising or stable, so trend-following indicators confirm the uptrend.
- The Moving Average structure is bullish. Price is above the EMA 50, EMA 200, SMA 50D, SMA 200D and VWAP. The SMA 50D ($55.97) has been above the SMA 200D ($53.95) since the summer rally, so the golden cross is already in place and widening. The EMA 50 is above the EMA 200 and the gap is growing.
- The Sept low near $53 held at the SMA 200D and EMA 200 cluster, and price has since rallied about 10%.
- The prior swing high around $58.3–59.2 in July and November is resistance. Price is now testing it, and a close above would be a breakout to new highs.
CHART PATTERNS
- Bullish Double Bottom / Reversal: The Sept low near $53 (above the 200-day averages) followed by a strong rally resembles a double-bottom-style reversal. The neckline is the prior high near $58–59, which price is now challenging.
- Ascending Triangle (continuation) possibility: Highs near $58–59 in July and November form flat resistance, while the lows have been rising. A confirmed close above about $59.50 would project a measured move of roughly the pattern height ($59 − $53 = $6), toward $64–65. That is an extended target, so I haircut it for a 62-day horizon.
- Risk: If price fails at $59, a Bearish Double Top at $59 is possible, with the neckline near $56 and a downside target around $54–55. This is the less probable outcome given ADX and DI strength.
POTENTIAL SCENARIOS
- Scenario 1: Bullish Breakout Continuation — Price pushes through the $59–59.50 resistance and continues the strong uptrend, supported by a rising ADX, a positive MACD and the stacked moving averages. Trigger: daily close above $59.50 on rising volume. Target: $62.00–$63.50. Invalidation: close below $56.50 (EMA 50). (50% probability)
- Scenario 2: Neutral Consolidation Then Grind Higher — Price stalls at resistance, digests gains in a $56.50–$59.50 range, and the EMA 50 and SMA 50D catch up, ending modestly higher. Trigger: rejection at $59 with RSI cooling to 50–55. Target: $58.00–$60.00. Invalidation: break above $59.50 or below $56. (30% probability)
- Scenario 3: Bearish Double-Top Pullback — Failed breakout at $59 with fading CMF and RSI divergence, leading to a pullback toward the SMA 50D and 200-day cluster. Trigger: close below $56.50 and a MACD bearish crossover. Target: $54.50–$55.50. Invalidation: close back above $59.50. (20% probability)
PRICE TARGETS
- Target Price: $61.00 (62-day horizon, ending around Jan 16, 2027)
- Expected Range: $54.50 to $65.00 (width $10.50, about 17.9% of current price, in line with the 12–18% guidance for 30–60 days and the lower end of 18–30% for 61–180 days)
- Key Levels: Support at $56.47 (EMA 50, with $55.97 SMA 50D beneath it), Resistance at $59.34 (upper Bollinger Band, near the $59.20 swing high)
OVERALL BIAS
OVERALL BIAS: BULLISH - Price is above all key moving averages with a golden cross in place, ADX at 38.6 with +DI far above -DI, and a positive MACD. Fading CMF and RSI relative to price warrant caution near $59 resistance, but a breakout favors the upside.
This is educational analysis and not financial advice.