XLF 6-day bullish forecast — Nov 1, 2026
- Bias: Bullish
- Timeframe: 6 days (made Nov 1, 2026, target date Nov 6, 2026)
- Price at analysis: $56.53
- Price target: $56.90
- Expected range: $55.35 – $58.00
- Result: Correct (+1.0%) — closed at $57.11 on Nov 6, 2026; quality score 100/100
Get a free AI analysis of XLF today
Analysis
TECHNICAL INDICATORS
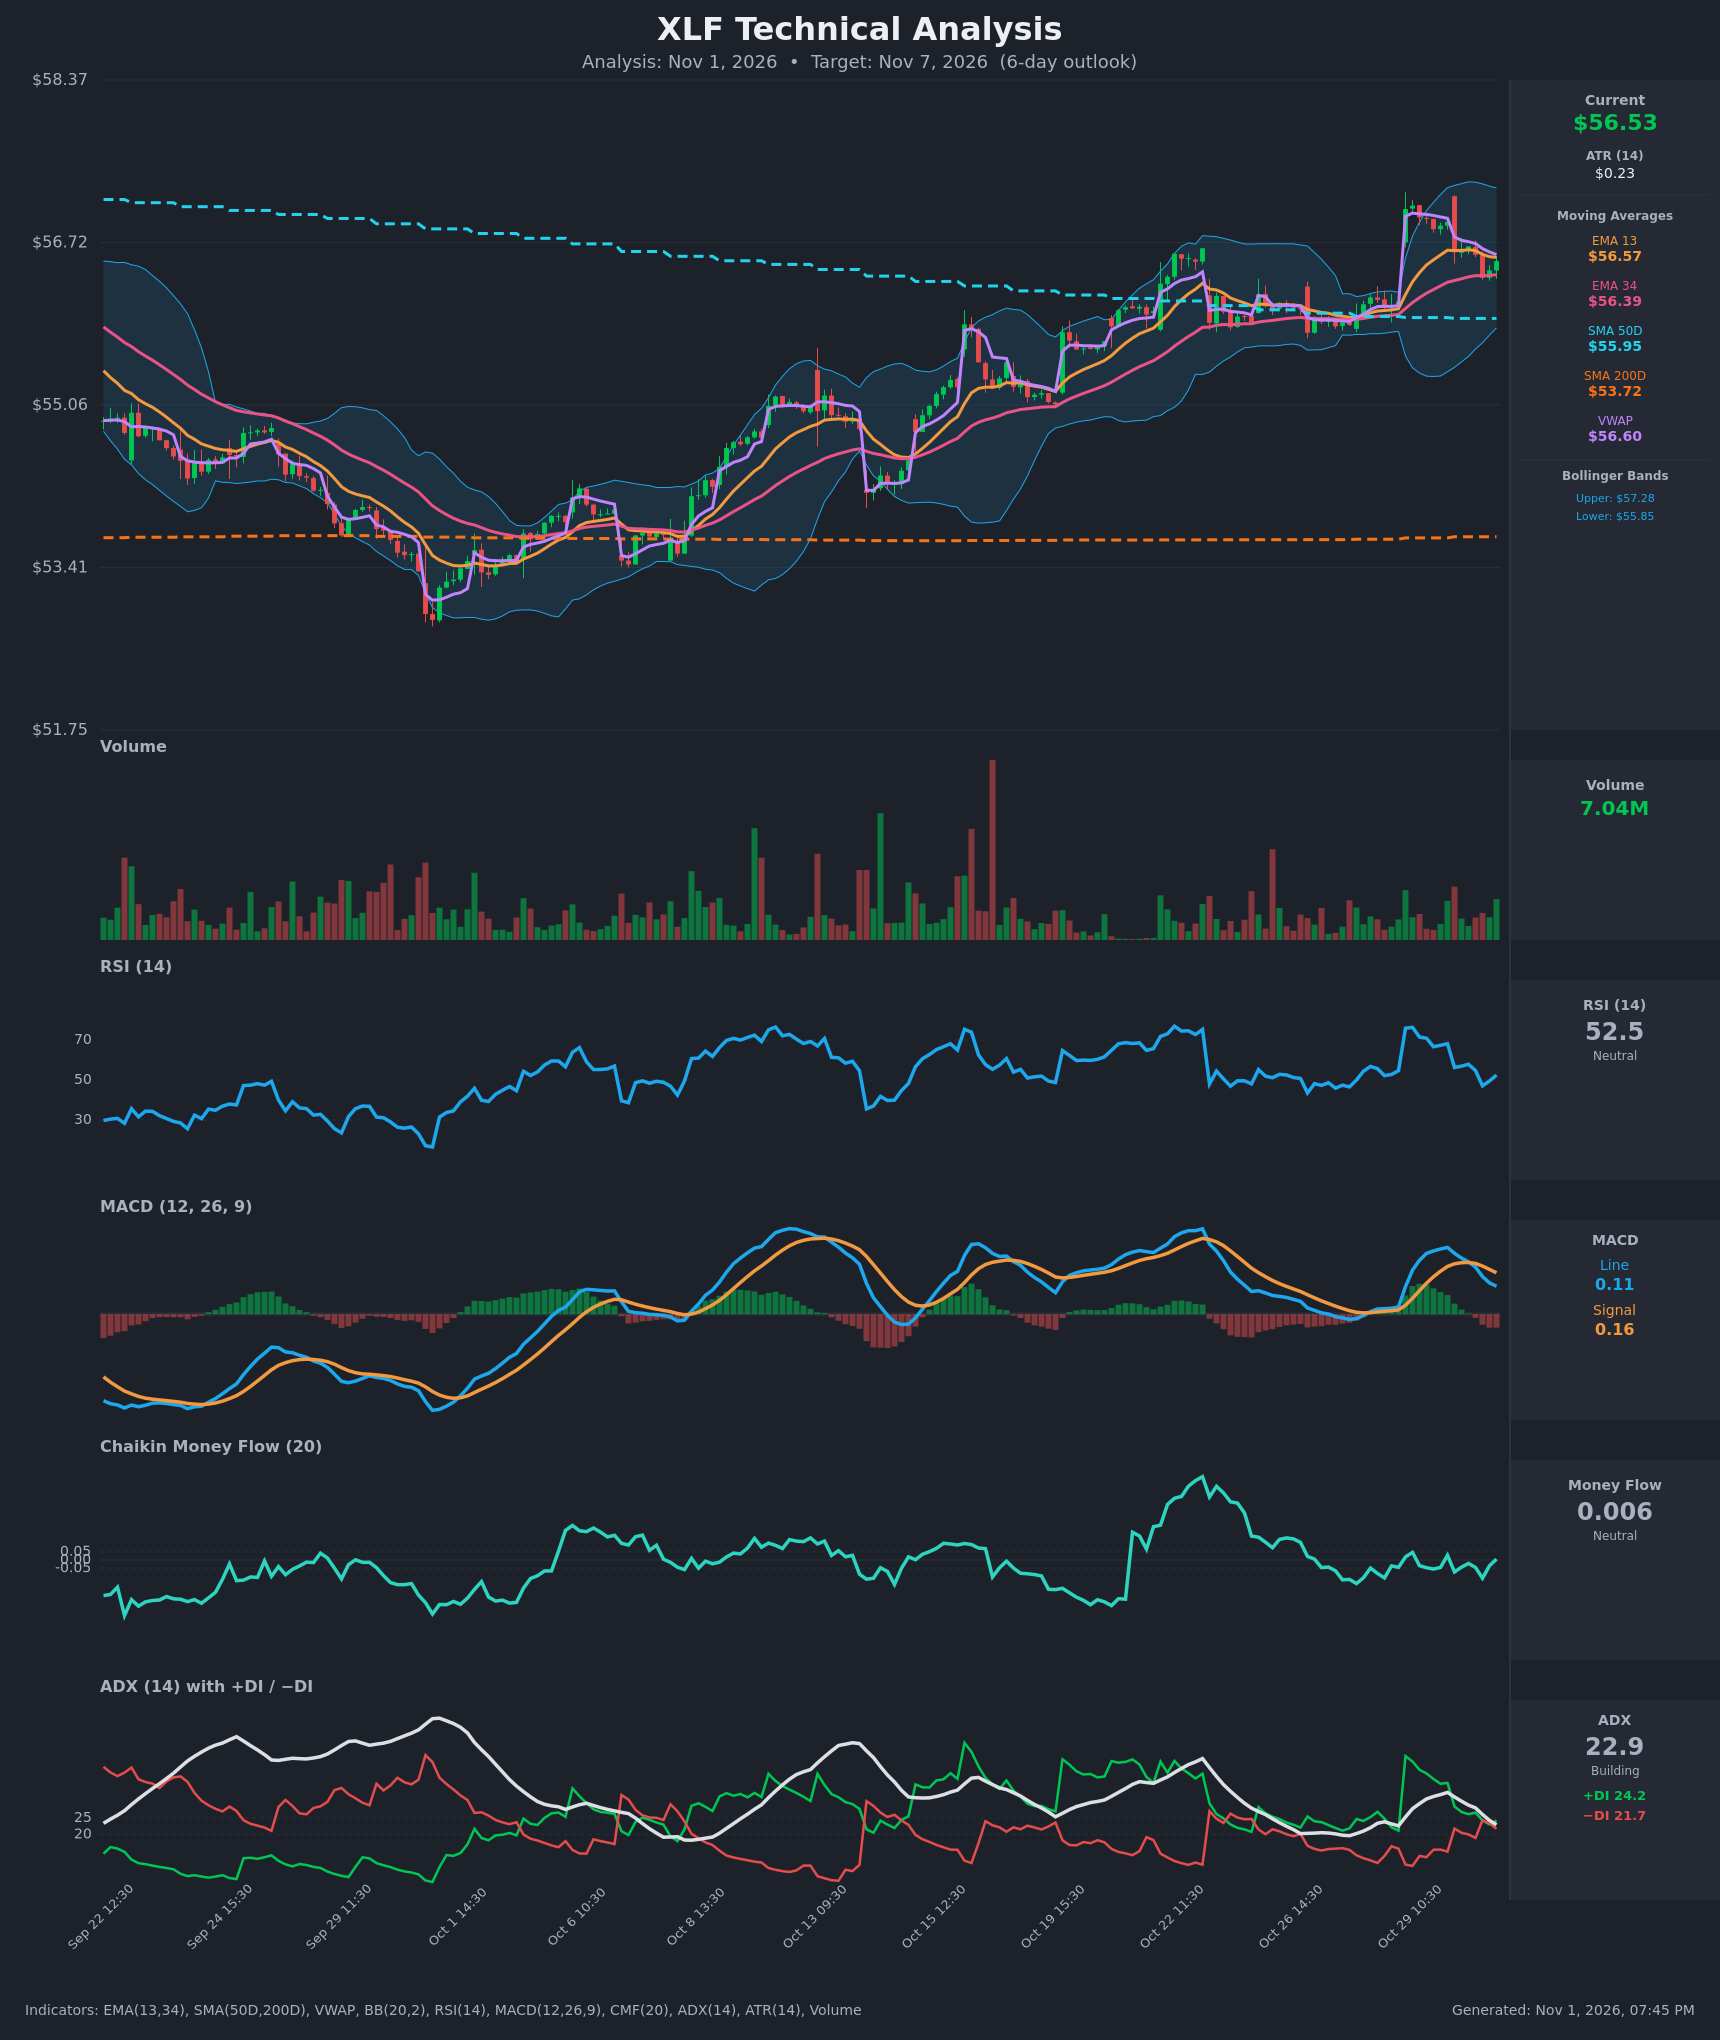
- RSI (14): 52.48, neutral. It dropped from 76 on the Oct 29 spike to a low of 47.1, and is now curling back up (47 → 49.5 → 52.5). Momentum has reset from overbought without breaking down. [Neutral]
- 20 EMA: The data gives EMA 13 at $56.57 and EMA 34 at $56.39. Price at $56.53 sits just below the EMA 13 (minor resistance) and above the EMA 34 (support). EMA 13 is above EMA 34, so the short-term trend is still up, but the gap is narrowing. [Neutral]
- MACD: Line 0.1075 is below Signal 0.1594, a bearish crossover that happened around Oct 30 12:30. Both lines are still positive and the histogram is slightly negative at about -0.05. The line has stopped falling as fast as before, so momentum is fading rather than reversing. [Bearish]
- Bollinger Bands (20): Upper $57.28, lower $55.85, with price at $56.53, almost exactly on the midline (~$56.56). The bands are fairly wide after the Oct 29 gap, and price is pinned mid-band with no squeeze or breakout. [Neutral]
- CMF (20): 0.006, inside the ±0.05 neutral zone. It has hovered around zero for several sessions, and the last bar ticked back above zero. There is no clear accumulation or distribution. [Neutral]
- ADX (14): 22.9 and falling from 32.8, so the trend is weakening. +DI at 24.2 is just above −DI at 21.7 after a brief cross at 24.3/24.3. Bulls hold a very slim edge. [Weak Trend, slight bullish lean]
- Volume: 7.04M on the last bar, near average, with the latest candle green. The pullback from the Oct 29 spike came on unremarkable volume, so there was no heavy distribution. [Neutral / mildly supportive]
Other moving averages and VWAP:
- Price is above the SMA50D ($55.95) and SMA200D ($53.72). That is a long-term uptrend, and SMA50D is well above SMA200D, a sustained golden-cross structure.
- Price is slightly below VWAP ($56.60), a mild short-term seller's tilt.
DIVERGENCES & TRENDS
- Mild bearish divergence: the Oct 29 high (~$57.10) was above the prior swing highs, but the MACD and CMF peaks were lower than their Oct 21–22 peaks. This shows some loss of momentum at the highs.
- RSI: it spiked above 75 and cooled to the 47–52 area. That is a healthy reset, not a bearish divergence.
- MACD: the bearish signal cross is recent, but both lines remain above zero, so the broader momentum trend is intact.
- ADX/DI: ADX has fallen from the 30s toward 23, which indicates consolidation after the spike. The +DI/−DI lines have converged, and +DI has just retaken the top.
- Trend structure: the chart shows higher lows since Oct 1 and a stack of rising MAs (EMA 13 > EMA 34 > SMA50 > SMA200). The pullback is holding above the EMA 34.
CHART PATTERNS
- Bullish Flag / Pennant (continuation): the Oct 29 gap from ~$56.1 to ~$57.1 forms the "pole," followed by a shallow, drifting-lower consolidation (flag) on lighter volume. A breakout above ~$56.95–57.10 projects a measured move of roughly $1.00, to about $57.5–58.0.
- Symmetrical Triangle (possible): price is compressing between lower highs and the rising EMA 34/SMA50 support. This is a bullish-leaning continuation setup given the prevailing uptrend.
- Failure condition: a loss of $56.39 and then $55.95 would turn this into a failed flag, with a bearish pennant/double-top flavor ($57.10 twice).
POTENTIAL SCENARIOS
- Scenario 1: Bullish Flag Breakout — Price holds the EMA 34 and the pullback resolves up, with RSI back above 55 and MACD re-crossing its signal. Trigger: hourly close above $56.95 and then $57.10 (the Oct 29 high). Target: $57.28 (upper BB), then $57.60–58.00. Invalidation: close below $56.30. (50% probability)
- Scenario 2: Neutral Range Chop — Price oscillates between the EMA 34/SMA50 support and the Oct 29 highs, with ADX drifting below 20. Trigger: failure to break either $56.39 or $57.10 decisively. Target: $56.30–56.90. Invalidation: a break and hold outside $56.00–57.30. (28% probability)
- Scenario 3: Bearish Failed Flag — The MACD bearish cross extends, −DI retakes control, and price loses the EMA 34 and SMA50. Trigger: hourly close below $56.39, then $55.95. Target: $55.85 (lower BB), then $55.50. Invalidation: reclaim of $56.75. (22% probability)
PRICE TARGETS
- Target Price: $56.90 (6-day horizon, a modest upside bias)
- Expected Range: $55.35 to $58.00 (width $2.65, about 4.7% of the current price, consistent with a 6-day window)
- Key Levels: Support at $56.39 (EMA 34), with deeper support at $55.95 (SMA50D). Resistance at $57.10 (Oct 29 high), with the upper Bollinger Band at $57.28 above that.
OVERALL BIAS
OVERALL BIAS: BULLISH - The long-term uptrend is intact (price above the SMA50D and SMA200D, EMA 13 above EMA 34), and the shallow pullback looks like a bullish flag. +DI has retaken −DI and RSI is turning up off 47, though the MACD bearish cross and weak ADX limit conviction.
This is educational analysis and not financial advice.