MSFT 6-day bearish forecast — Nov 1, 2026
- Bias: Bearish
- Timeframe: 6 days (made Nov 1, 2026, target date Nov 6, 2026)
- Price at analysis: $521.90
- Price target: $518.50
- Expected range: $507.50 – $530.00
- Result: Incorrect (+1.8%) — closed at $531.45 on Nov 6, 2026; quality score 48/100
Get a free AI analysis of MSFT today
Analysis
TECHNICAL INDICATORS
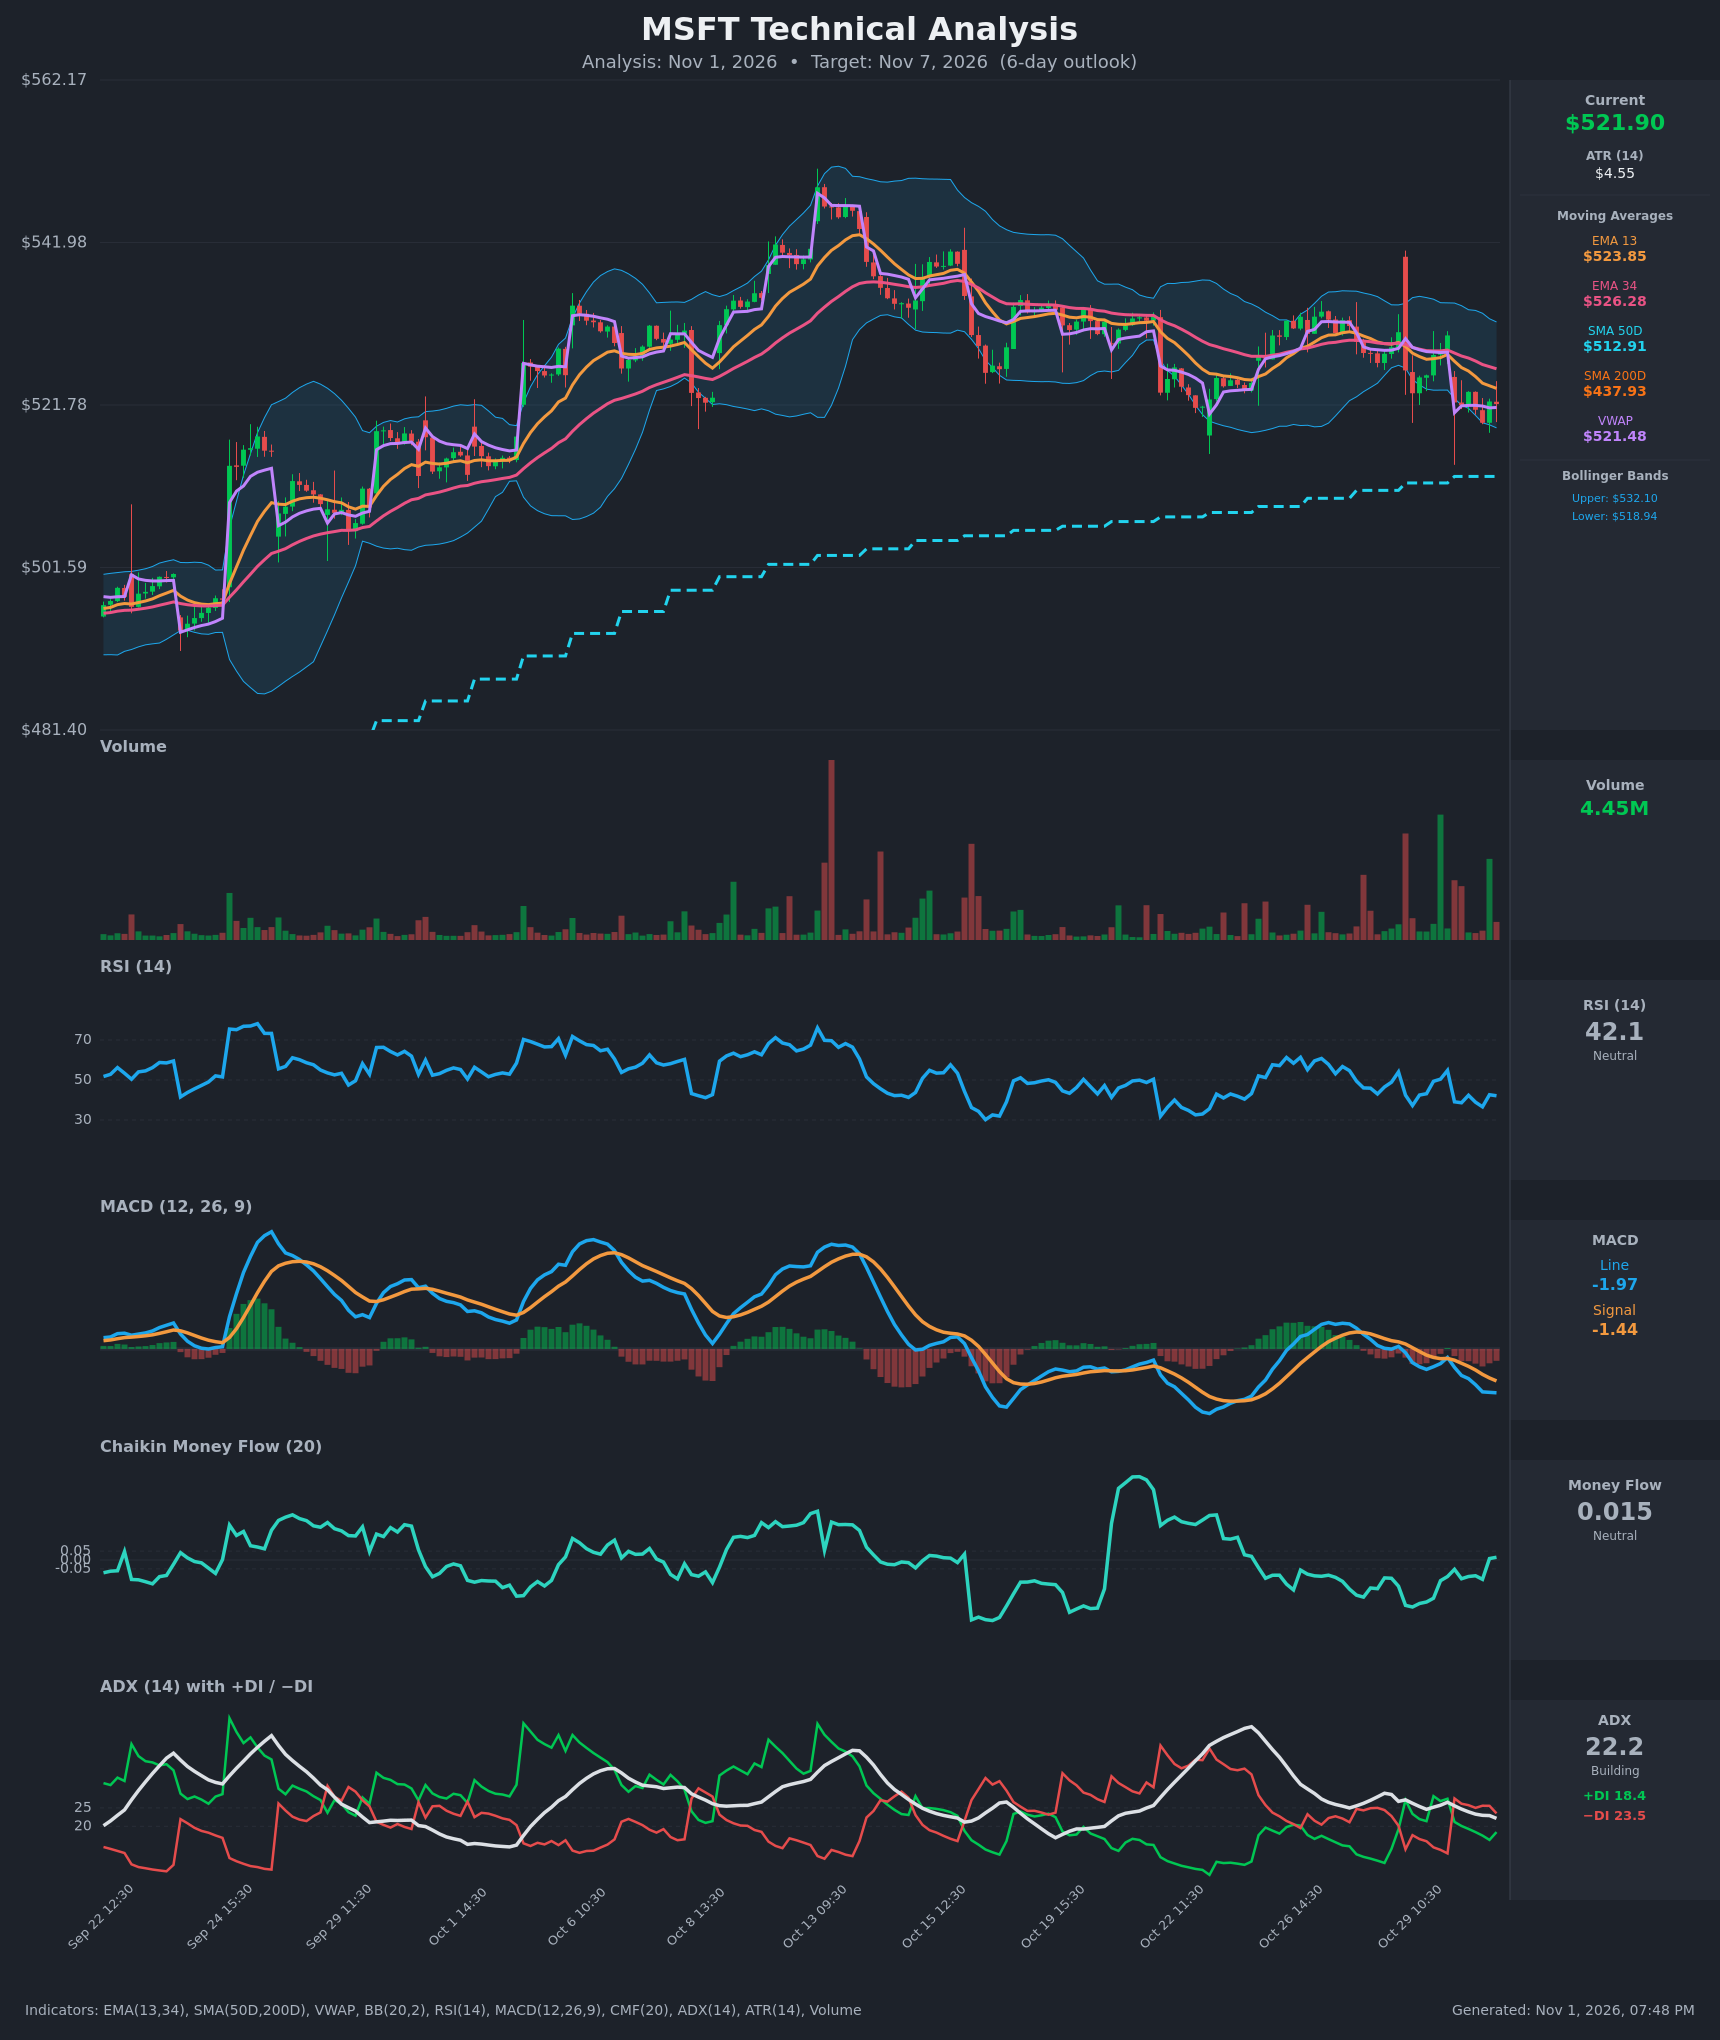
- RSI (14): 42.1, below the 50 midline and drifting lower after a bounce to ~55 on Oct 29. It is not oversold (<30), but it keeps making lower highs, so momentum is leaning down. [Bearish]
- 20 EMA: The chart shows EMA 13 at $523.85 and EMA 34 at $526.28, and price at $521.90 is below both. EMA13 is below EMA34 and the gap is widening, so both act as overhead resistance (~$524–526). [Bearish]
- MACD: Line -1.97 is below Signal -1.44, and the histogram is increasingly negative. The bearish crossover happened around Oct 29, and momentum is still weakening with no sign of a turn. [Bearish]
- Bollinger Bands (20): Upper $532.10, lower $518.94, so price is in the lower third of the bands at $521.90, about $3 above the lower band. The bands are narrowing and price is hugging the lower half. A touch of the lower band could trigger a short-term bounce, but the walk lower leans negative. [Neutral]
- CMF (20): 0.015 sits between -0.05 and +0.05. It has recovered from about -0.25 on Oct 29, so selling pressure is easing, but it is not yet accumulation. [Neutral]
- ADX (14): 22.2 and falling from 26.8, with -DI (23.5) above +DI (18.4). The trend is marginal but tilted bearish, and ADX is not confirming a strong trend. [Weak Trend, Bearish tilt]
- Volume: 4.45M is a moderate bar after several high-volume red spikes on Oct 28–30. The largest recent volume came on the down moves, which points to distribution on the declines. [Mildly Bearish]
DIVERGENCES & TRENDS
- No clear divergence. RSI and MACD both confirm the price pullback from ~$535 to ~$522.
- CMF is improving (from -0.25 to +0.015) while price makes lower lows. This is a minor positive divergence, suggesting selling is being absorbed.
- The EMA13/EMA34 bearish crossover is established, and price is below both. The gap-down on Oct 30 morning (from $530.43 to $522.10) left VWAP-anchored resistance overhead.
- Price is at VWAP ($521.48), a neutral-to-slightly-supportive reading.
- SMA50D ($512.91) is rising and sits ~1.7% below price. SMA200D ($437.93) is far below, so the long-term uptrend is intact (golden cross long since in place). A pullback toward the SMA50D is the natural downside magnet.
- ADX is falling toward 20 while -DI leads, which points to a fading, choppy trend rather than a strong breakdown.
CHART PATTERNS
- The pattern is a loose Bearish Rising Wedge / Head and Shoulders-like top at the Oct 13–15 peak (~$547). Price has rolled over and made lower highs (~$535 → ~$531 → ~$530).
- Price has made successive lower highs and equal-ish lows near $519–522, a developing descending triangle bias. A break below ~$519 (lower BB and recent lows) would project toward the SMA50D at ~$513 and below.
- The measured move from a descending triangle break is roughly $8–10 (triangle height), which would aim at ~$510–512, in line with the SMA50D.
- Because the long-term trend is up and ADX is weak, a failed breakdown and a range between $519 and $530 is the main alternative.
POTENTIAL SCENARIOS
- Scenario 1: Bearish Breakdown Toward SMA50D — Price fails at EMA13/EMA34 resistance (~$524–526) and breaks the Oct 30 low and lower Bollinger Band. MACD and -DI dominance continue. Trigger: close below $519.00. Target: $512–514 (SMA50D). Invalidation: close above $526.30 (EMA34). (50% probability)
- Scenario 2: Neutral Range-Bound Chop — Price holds above $518–519, with CMF stabilizing, and oscillates around VWAP below the EMAs. Trigger: failure to break either $519 or $526. Target: $519–$526. Invalidation: a close outside that range. (25% probability)
- Scenario 3: Bullish Mean-Reversion Bounce — Oversold-ish conditions at the lower band and improving CMF produce a bounce back through the EMAs. Trigger: reclaim of $526.30 on rising volume. Target: $531–532 (upper BB). Invalidation: close back below $520. (25% probability)
PRICE TARGETS
- Target Price: $518.50 (6-day horizon)
- Expected Range: $507.50 to $530.00 (width $22.50 ≈ 4.3% of current price, consistent with the ~4–8% guide for a 6-day timeframe)
- Key Levels: Support at $518.94 (lower Bollinger Band; then $512.91 SMA50D), Resistance at $526.28 (EMA 34; then $532.10 upper BB)
OVERALL BIAS
OVERALL BIAS: BEARISH - EMA13 is below EMA34 with price beneath both, MACD is below signal with a falling histogram, RSI is under 50, and -DI leads +DI. This points to a drift toward the lower band and possibly the SMA50D, though the weak ADX and improving CMF limit conviction.
This is educational analysis and not financial advice.