MSFT 27-day bearish forecast — Nov 15, 2026
- Bias: Bearish
- Timeframe: 27 days (made Nov 15, 2026, target date Dec 11, 2026)
- Price at analysis: $523.88
- Price target: $512.00
- Expected range: $480.00 – $552.00
- Result: Pending — graded after the close on Dec 11, 2026
Get a free AI analysis of MSFT today
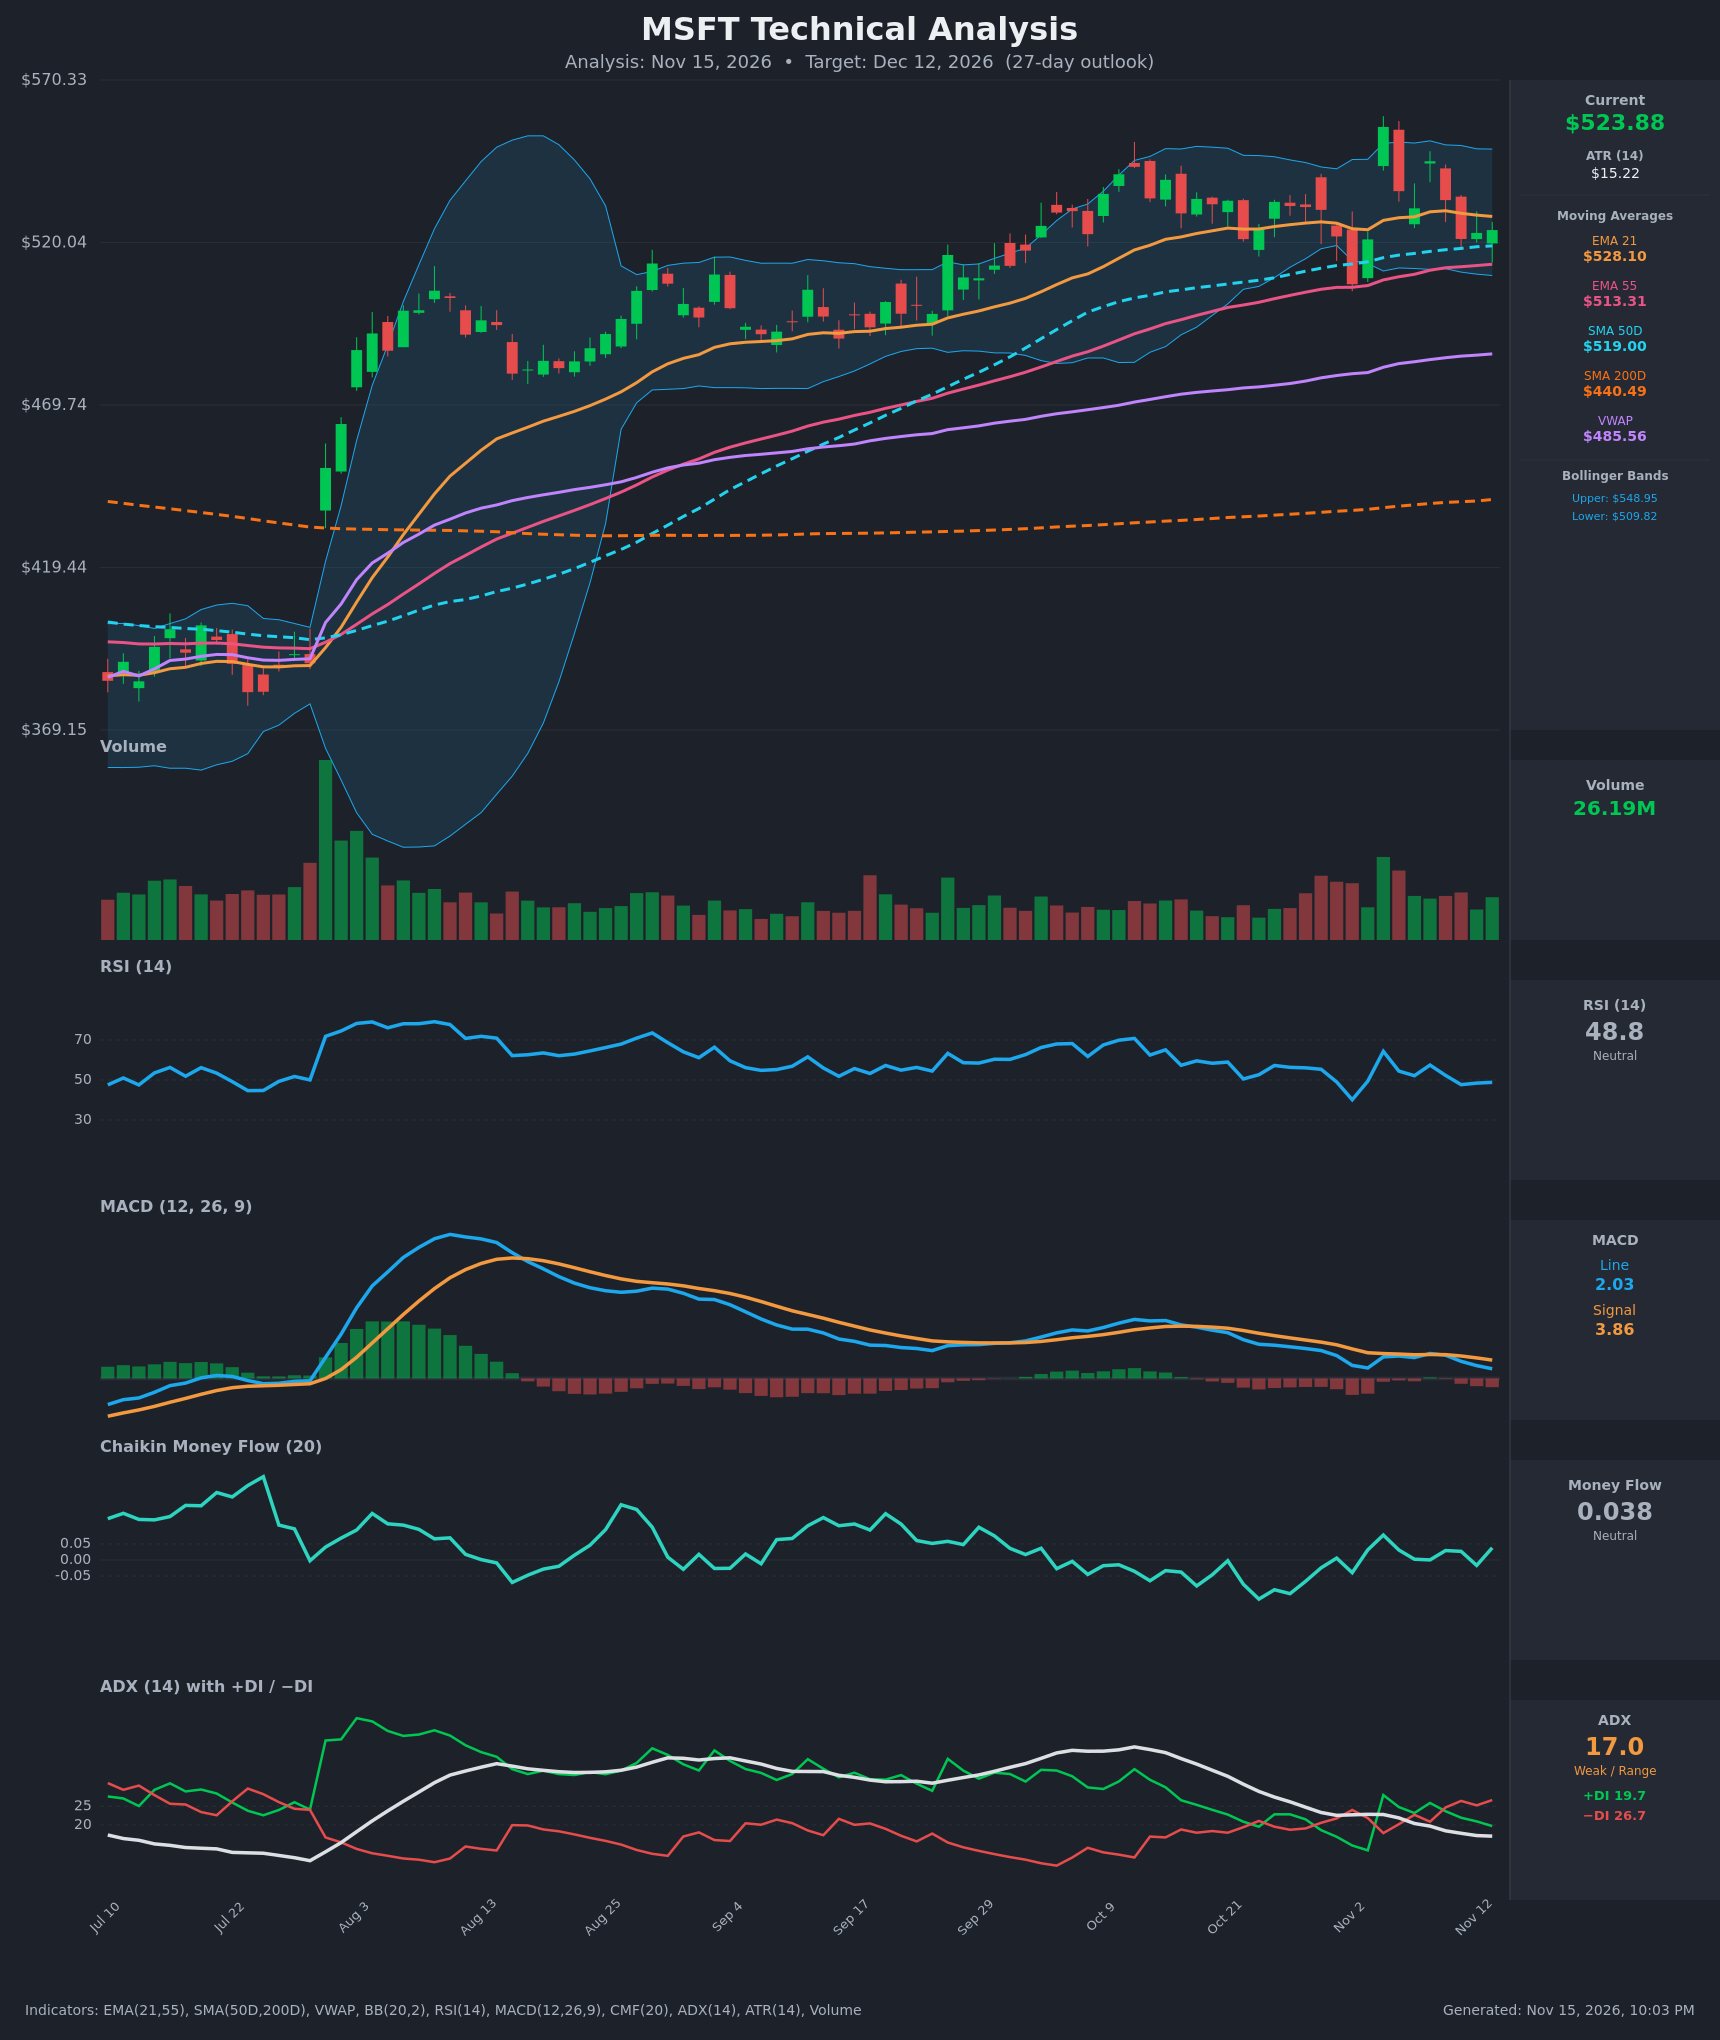
Analysis
TECHNICAL INDICATORS
- RSI (14): 48.82, right at the 50 midline. It has fallen from 57.5 on Nov 9, so momentum is fading, and it sits well below the 64 spike on Nov 4. [Neutral]
- 20 EMA: EMA21 is $528.10 and price ($523.88) is below it, so the EMA now acts as resistance. EMA21 is rolling over from $529.87. Price is still above EMA55 ($513.31), which is rising. [Bearish]
- MACD: The line (2.03) is below the signal (3.86), a bearish crossover since about Oct 30. The histogram is negative at about -1.83 and has widened slightly from -1.62. Both lines are drifting toward zero, which shows momentum decay. [Bearish]
- Bollinger Bands (20): Upper is $548.95, lower is $509.82, and the midline is about $529. Price is below the midline in the lower half of the bands. The bands are moderately narrow, which fits consolidation. The Nov 4 spike to $555.80 was rejected from the upper band. [Neutral]
- CMF (20): 0.038, inside the ±0.05 neutral zone. It has oscillated around zero for weeks, with no sustained accumulation or distribution. [Neutral]
- ADX (14): 17.0 and falling from 27 on Oct 26, which is below 20 and means a weak, range-bound trend. −DI (26.7) is above +DI (19.7), a bearish DI crossover since Nov 10, and the gap is widening. [Weak Trend, bearish lean]
- Volume: 26.19M, average to slightly below average. There were no volume surges on the recent pullbacks, though the Nov 4 spike came on higher volume and failed to follow through. There is no strong conviction either way. [Neutral]
DIVERGENCES & TRENDS
- Long-term trend: Price is above SMA200D ($440.49), SMA50D ($519.00), EMA55 ($513.31) and VWAP ($485.56). The golden cross is long established and SMA50D is still rising. That is a structural uptrend.
- Short-term deterioration: Price has lost EMA21, the MACD is below its signal, −DI has crossed above +DI and RSI is below 50. SMA50D ($519.00) is only about $5 below price, so a test of it is likely.
- Failed breakout: The Nov 4 spike to $555.80 reversed immediately. Highs are not extending, and price has returned inside the Oct–Nov range of about $507–$556.
- Trend strength: ADX has dropped from 27 to 17, so the trend is fading into consolidation rather than reversing.
- Divergence: There is no clear RSI or price divergence. The MACD has trended lower while price held flat, a mild bearish tilt.
CHART PATTERNS
- Range with lower highs (Bearish Expanding Triangle or Double Top-like): The Nov 4 spike to ~$556 and the Nov 9 high near $545 form a possible lower high under the upper band. Support sits around $507–$510. A close below $507 would confirm a breakdown, with a measured move toward $490.
- Possible Symmetrical Triangle/range: Price is compressing between the EMA21/EMA55/SMA50D cluster ($513–$528). A break below $507 favors the bearish side, while a close above $548 would invalidate it.
- No strong reversal pattern is confirmed. The bias rests on momentum deterioration inside a still-intact larger uptrend, so conviction is modest.
POTENTIAL SCENARIOS
- Scenario 1: Bearish Pullback to the SMA50D/Lower Band Zone — Momentum is fading, with MACD and DI both bearish and price below EMA21. Price tests and breaks the EMA55/SMA50D cluster. Trigger: daily close below $507. Target: $490–$500, with $512 as the 27-day central estimate. Invalidation: a close above $530 (EMA21 reclaim with MACD turning up). (45% probability)
- Scenario 2: Neutral Range Chop — ADX stays below 20 and price oscillates between $507 and $545 around the moving-average cluster. Trigger: repeated holds above $507 and rejections near $530–$545. Target: $515–$530. Invalidation: a close outside $505–$550. (30% probability)
- Scenario 3: Bullish Resumption of the Uptrend — Buyers defend the SMA50D/EMA55, MACD re-crosses up and price retakes EMA21. Trigger: close above $530 on rising volume. Target: $548–$556, the upper band and prior high. Invalidation: a close below $507. (25% probability)
PRICE TARGETS
- Target Price: $512.00 (27-day target)
- Expected Range: $480.00 to $552.00 (width $72, about 13.7% of current price, scaled for a 27-day horizon)
- Key Levels: Support at $513.31 (EMA55; below that $509.82 lower band and $507.00 swing low), Resistance at $528.10 (EMA21; above that $548.95 upper band)
OVERALL BIAS
OVERALL BIAS: BEARISH - Short-term momentum has turned down, with MACD below its signal, −DI above +DI, price below EMA21 and RSI below 50, so a modest pullback toward the $507–$513 support cluster is more likely than not. The long-term uptrend above SMA200D limits the downside, which keeps conviction modest.
This is educational analysis and not financial advice.