MSFT 48-day bullish forecast — Nov 15, 2026
- Bias: Bullish
- Timeframe: 48 days (made Nov 15, 2026, target date Jan 1, 2027)
- Price at analysis: $523.88
- Price target: $536.00
- Expected range: $490.00 – $568.00
- Result: Pending — graded after the close on Jan 1, 2027
Get a free AI analysis of MSFT today
Analysis
TECHNICAL INDICATORS
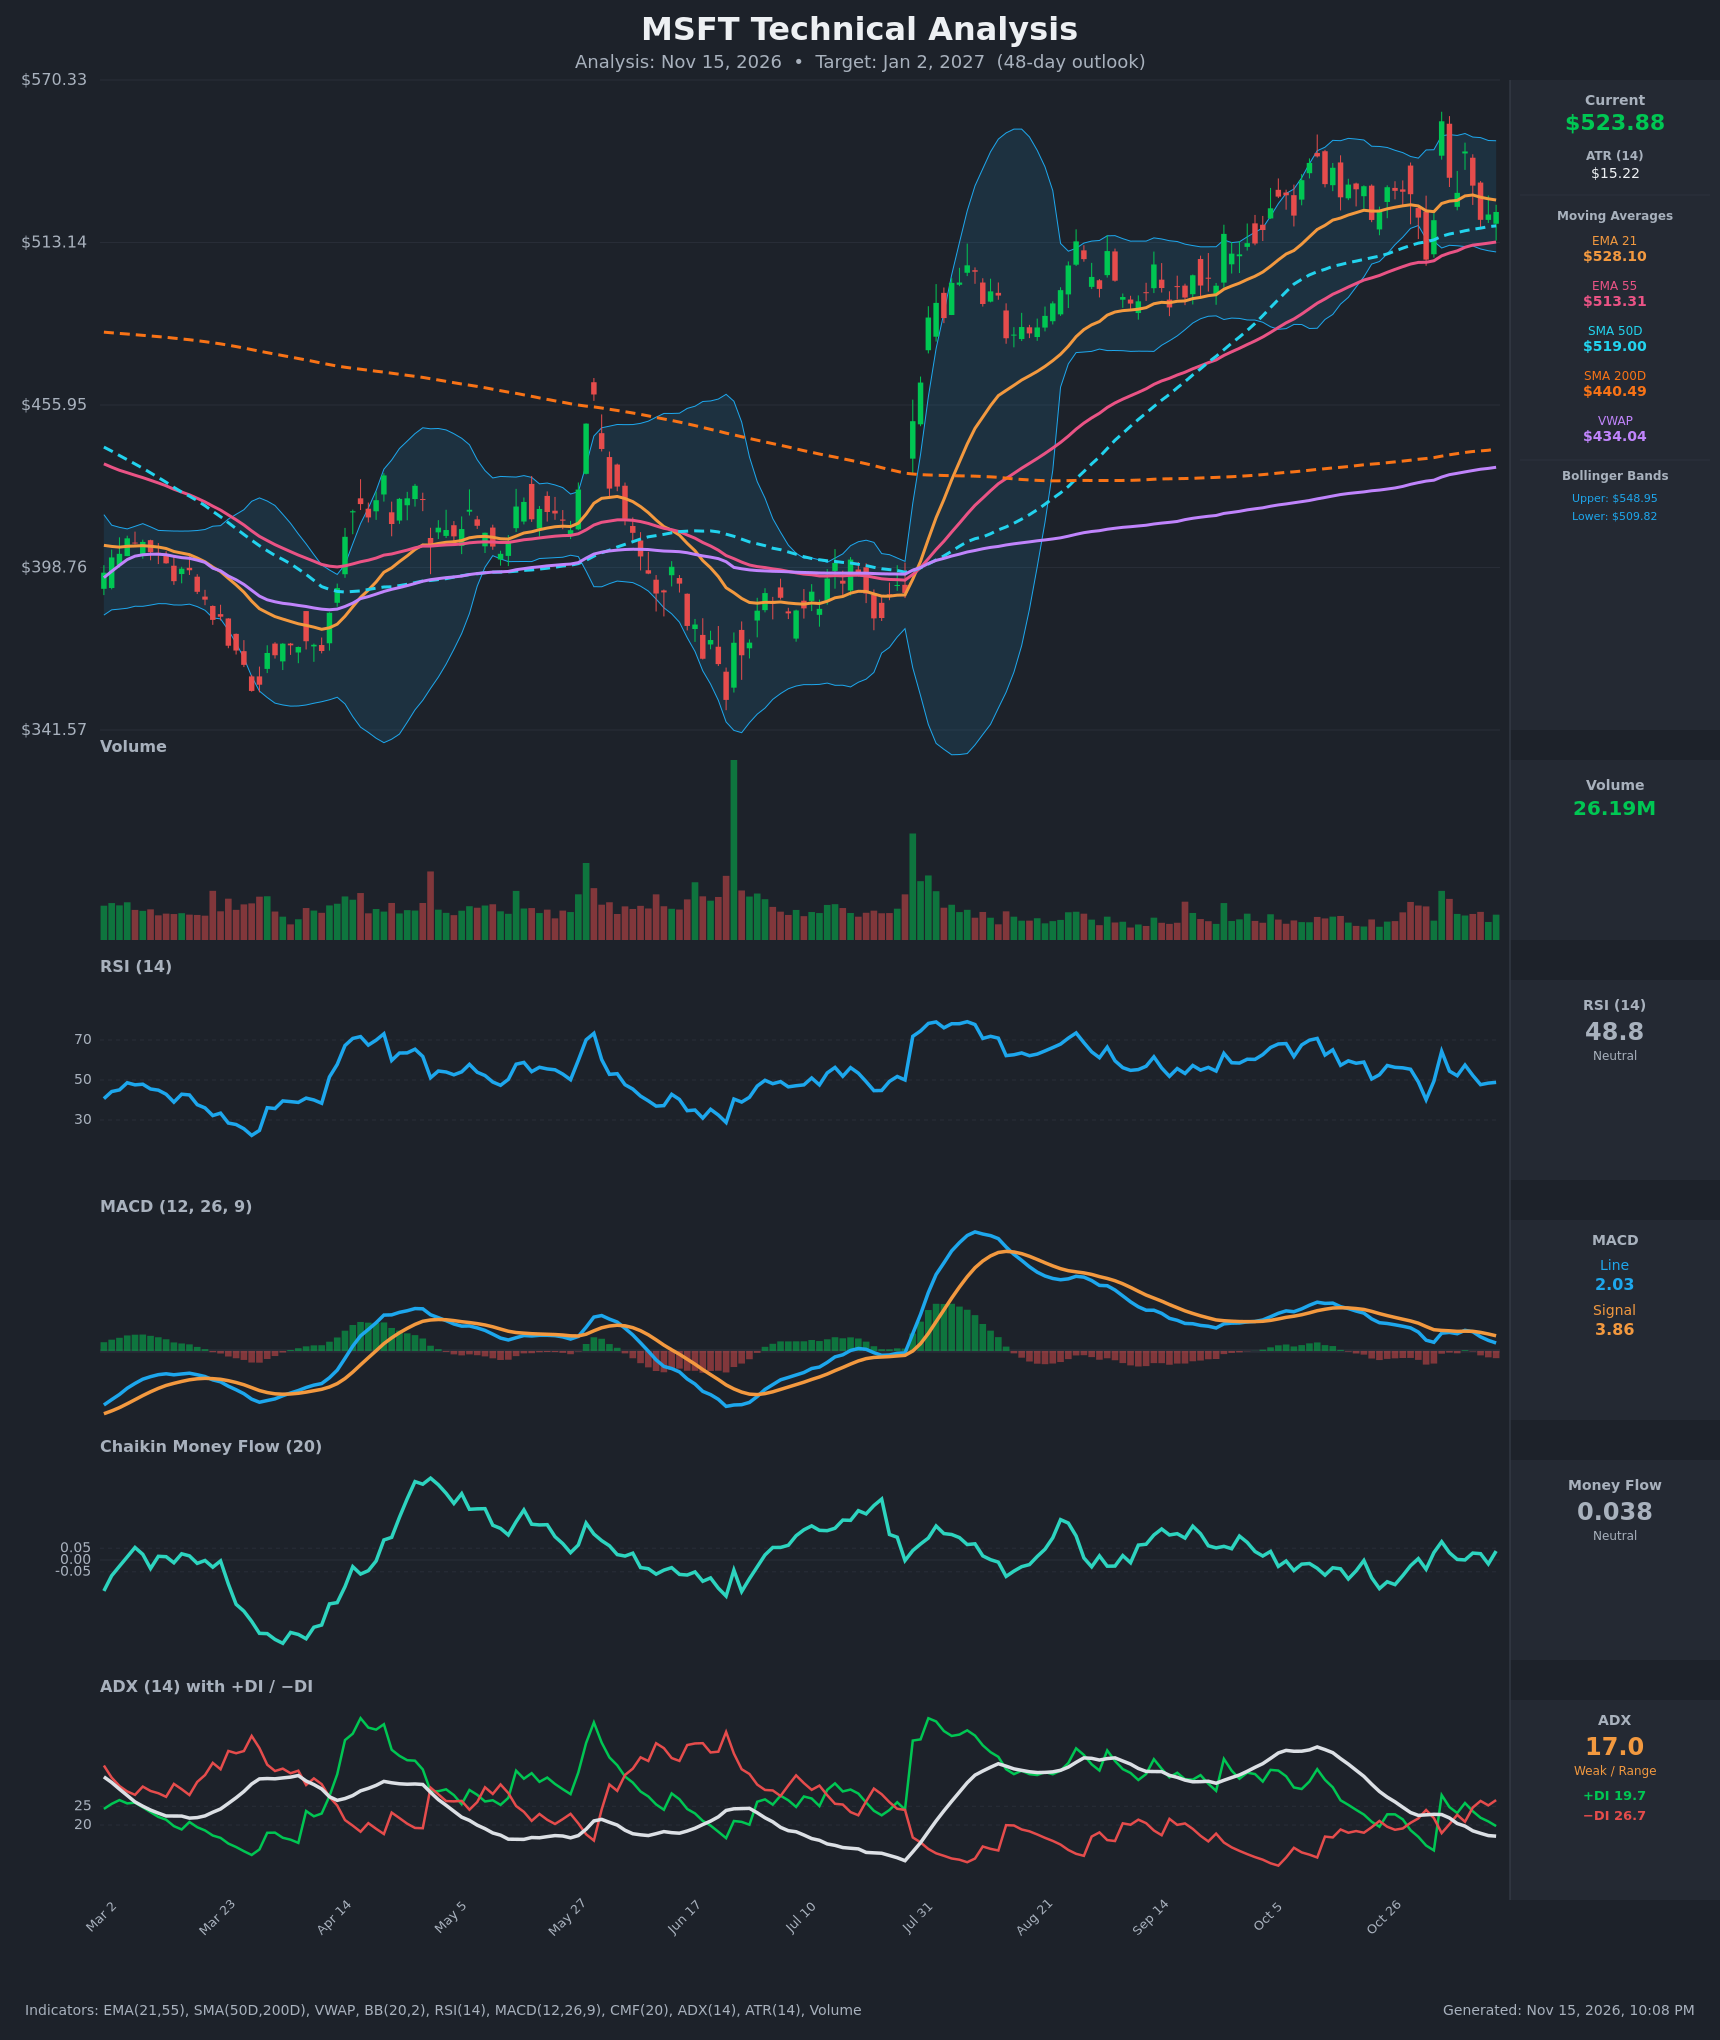
- RSI (14): 48.82, neutral and slightly below the midline. It has swung between 40 and 64 over the last two weeks (Nov 2 low of 40.1, Nov 4 high of 64.3) and has not reached overbought. Momentum is flat to slightly fading. [Neutral]
- 20 EMA (EMA 21): $528.10. Price at $523.88 sits just below it, so it is acting as near-term resistance. The EMA 21 is rolling over from $529.87 on Nov 10. The EMA 21/55 gap has narrowed from about $22 to about $15, but there is no crossover yet. [Bearish]
- MACD: Line 2.03 is below Signal 3.86. This is a bearish crossover that occurred around Nov 11, and the histogram is negative. Both lines are falling toward zero but remain positive, so the broader uptrend is intact while short-term momentum is cooling. [Bearish]
- Bollinger Bands (20): Upper $548.95, lower $509.82, midline about $529.4. Price is just below the midline in the lower half of the bands. The bands are moderately wide after the Nov 4 spike. The price sits mid-range with no squeeze or breakout. [Neutral]
- CMF (20): 0.038, between -0.05 and +0.05. It has oscillated around zero for weeks, which shows no decisive accumulation or distribution. [Neutral]
- ADX (14): 17.0 and falling from 27.4 in late October, so the trend is weak or range-bound. −DI (26.7) is above +DI (19.7), so bears have a modest edge in the short term, but with ADX this low it is not a trending signal. [Weak Trend, Bearish lean]
- Volume: 26.19M, which is subdued compared with the July surge. The Nov 4 spike to $555.80 reversed immediately, which suggests supply near the highs. Recent volume is not confirming either direction. [Neutral / low participation]
Other trend context:
- Price is above the SMA50D ($519.00), the EMA55 ($513.31) and the SMA200D ($440.49), so the long-term uptrend is intact.
- Price is far above VWAP ($434.04), which means a stretched cost basis but a bullish structure.
- The golden cross is long established, with SMA50D well above SMA200D.
DIVERGENCES & TRENDS
- No clear divergences: price is flat to slightly lower within its range, and RSI, MACD and CMF are all drifting sideways or lower to match.
- Fading momentum: MACD has rolled from 6.98 to 2.03 and ADX from 27.4 to 17.0 over about 13 sessions. This reflects a consolidation after the Sep–Oct advance rather than a reversal.
- Lower highs, higher lows: the Nov 4 spike to $555.80 faded quickly, while the Nov 2 low ($507.12) held above the EMA55 and SMA50D cluster. The result is a tightening-to-sideways structure.
- Key moving-average support: the EMA55 ($513.31) and SMA50D ($519.00) are rising and sit just below price, forming a support zone at about $513–$519.
- Bearish crossovers: MACD has crossed below its signal line and −DI has crossed above +DI. Price is also below the EMA21 and has lost it twice in the last six sessions.
CHART PATTERNS
- Consolidation (rectangle / symmetrical triangle): price has been range-bound between about $507–$510 and $548–$556 for the last several weeks. The reference diagram's Symmetrical Triangle (continuation) fits best, since it follows a prior uptrend. The range holds roughly 45 points of height, so a breakout measured move points to about $570 on the upside or about $470 on the downside.
- Mild bearish elements: the failed spike on Nov 4 and the lower highs resemble a Bearish Double Top or Rising Wedge in the short term. These are not confirmed unless price breaks $507–$510.
- Bias: the dominant higher-timeframe structure is an uptrend with rising support, so continuation after consolidation is more likely than a reversal. A close below $507 would invalidate that read.
POTENTIAL SCENARIOS
- Scenario 1: Bullish Consolidation Resolves Higher — Price holds the EMA55/SMA50D support zone, MACD turns back up as the consolidation unwinds, and the uptrend resumes. Trigger: a daily close above the EMA21 (about $528) and then above $549 (upper Bollinger Band) on improving volume and CMF above +0.05. Target: $549 first, then $565–$570 (the prior high plus a measured move). Invalidation: a daily close below $507. (45% probability)
- Scenario 2: Bearish Breakdown Of The Range — Weak momentum (MACD below signal, −DI above +DI) leads to a loss of the $513–$519 support cluster and a breakdown of the range low. Trigger: a daily close below $507 with CMF below -0.05. Target: $490 first, then $470–$478. Invalidation: a reclaim of $530 (EMA21) and a close above $549. (30% probability)
- Scenario 3: Neutral Range Chop — ADX stays below 20 and price oscillates between about $510 and $550 around the Bollinger midline. Trigger: no daily close beyond $507 or $549. Target: $515–$535. Invalidation: a decisive close outside the $507–$556 range. (25% probability)
PRICE TARGETS
For the 48-day horizon (to about Jan 2, 2027), I lean modestly bullish because the long-term uptrend is intact and price is near its rising support cluster.
- Target Price: $536.00 (48 days)
- Expected Range: $490.00 to $568.00. The width is $78, which is about 14.9% of the current price. That is within the 12–18% guidance for 30–60 days and is far wider than a 14-day range.
- Key Levels: Support at $513.31 (EMA55, with the SMA50D near $519 and the lower Bollinger Band at $509.82 below it), Resistance at $548.95 (upper Bollinger Band, with the Nov 4 high near $555.80 above it)
OVERALL BIAS
OVERALL BIAS: BULLISH - Price remains above the rising EMA55, SMA50D and SMA200D with CMF slightly positive and higher lows intact, so a range-bound resolution upward is the most probable path. Short-term momentum is weak (MACD below signal, −DI above +DI, price under the EMA21), so conviction is modest and a close below $507 would flip the view.
This is educational analysis and not financial advice.