MSFT 62-day bullish forecast — Nov 15, 2026
- Bias: Bullish
- Timeframe: 62 days (made Nov 15, 2026, target date Jan 15, 2027)
- Price at analysis: $523.88
- Price target: $540.00
- Expected range: $478.00 – $593.00
- Result: Pending — graded after the close on Jan 15, 2027
Get a free AI analysis of MSFT today
Analysis
TECHNICAL INDICATORS
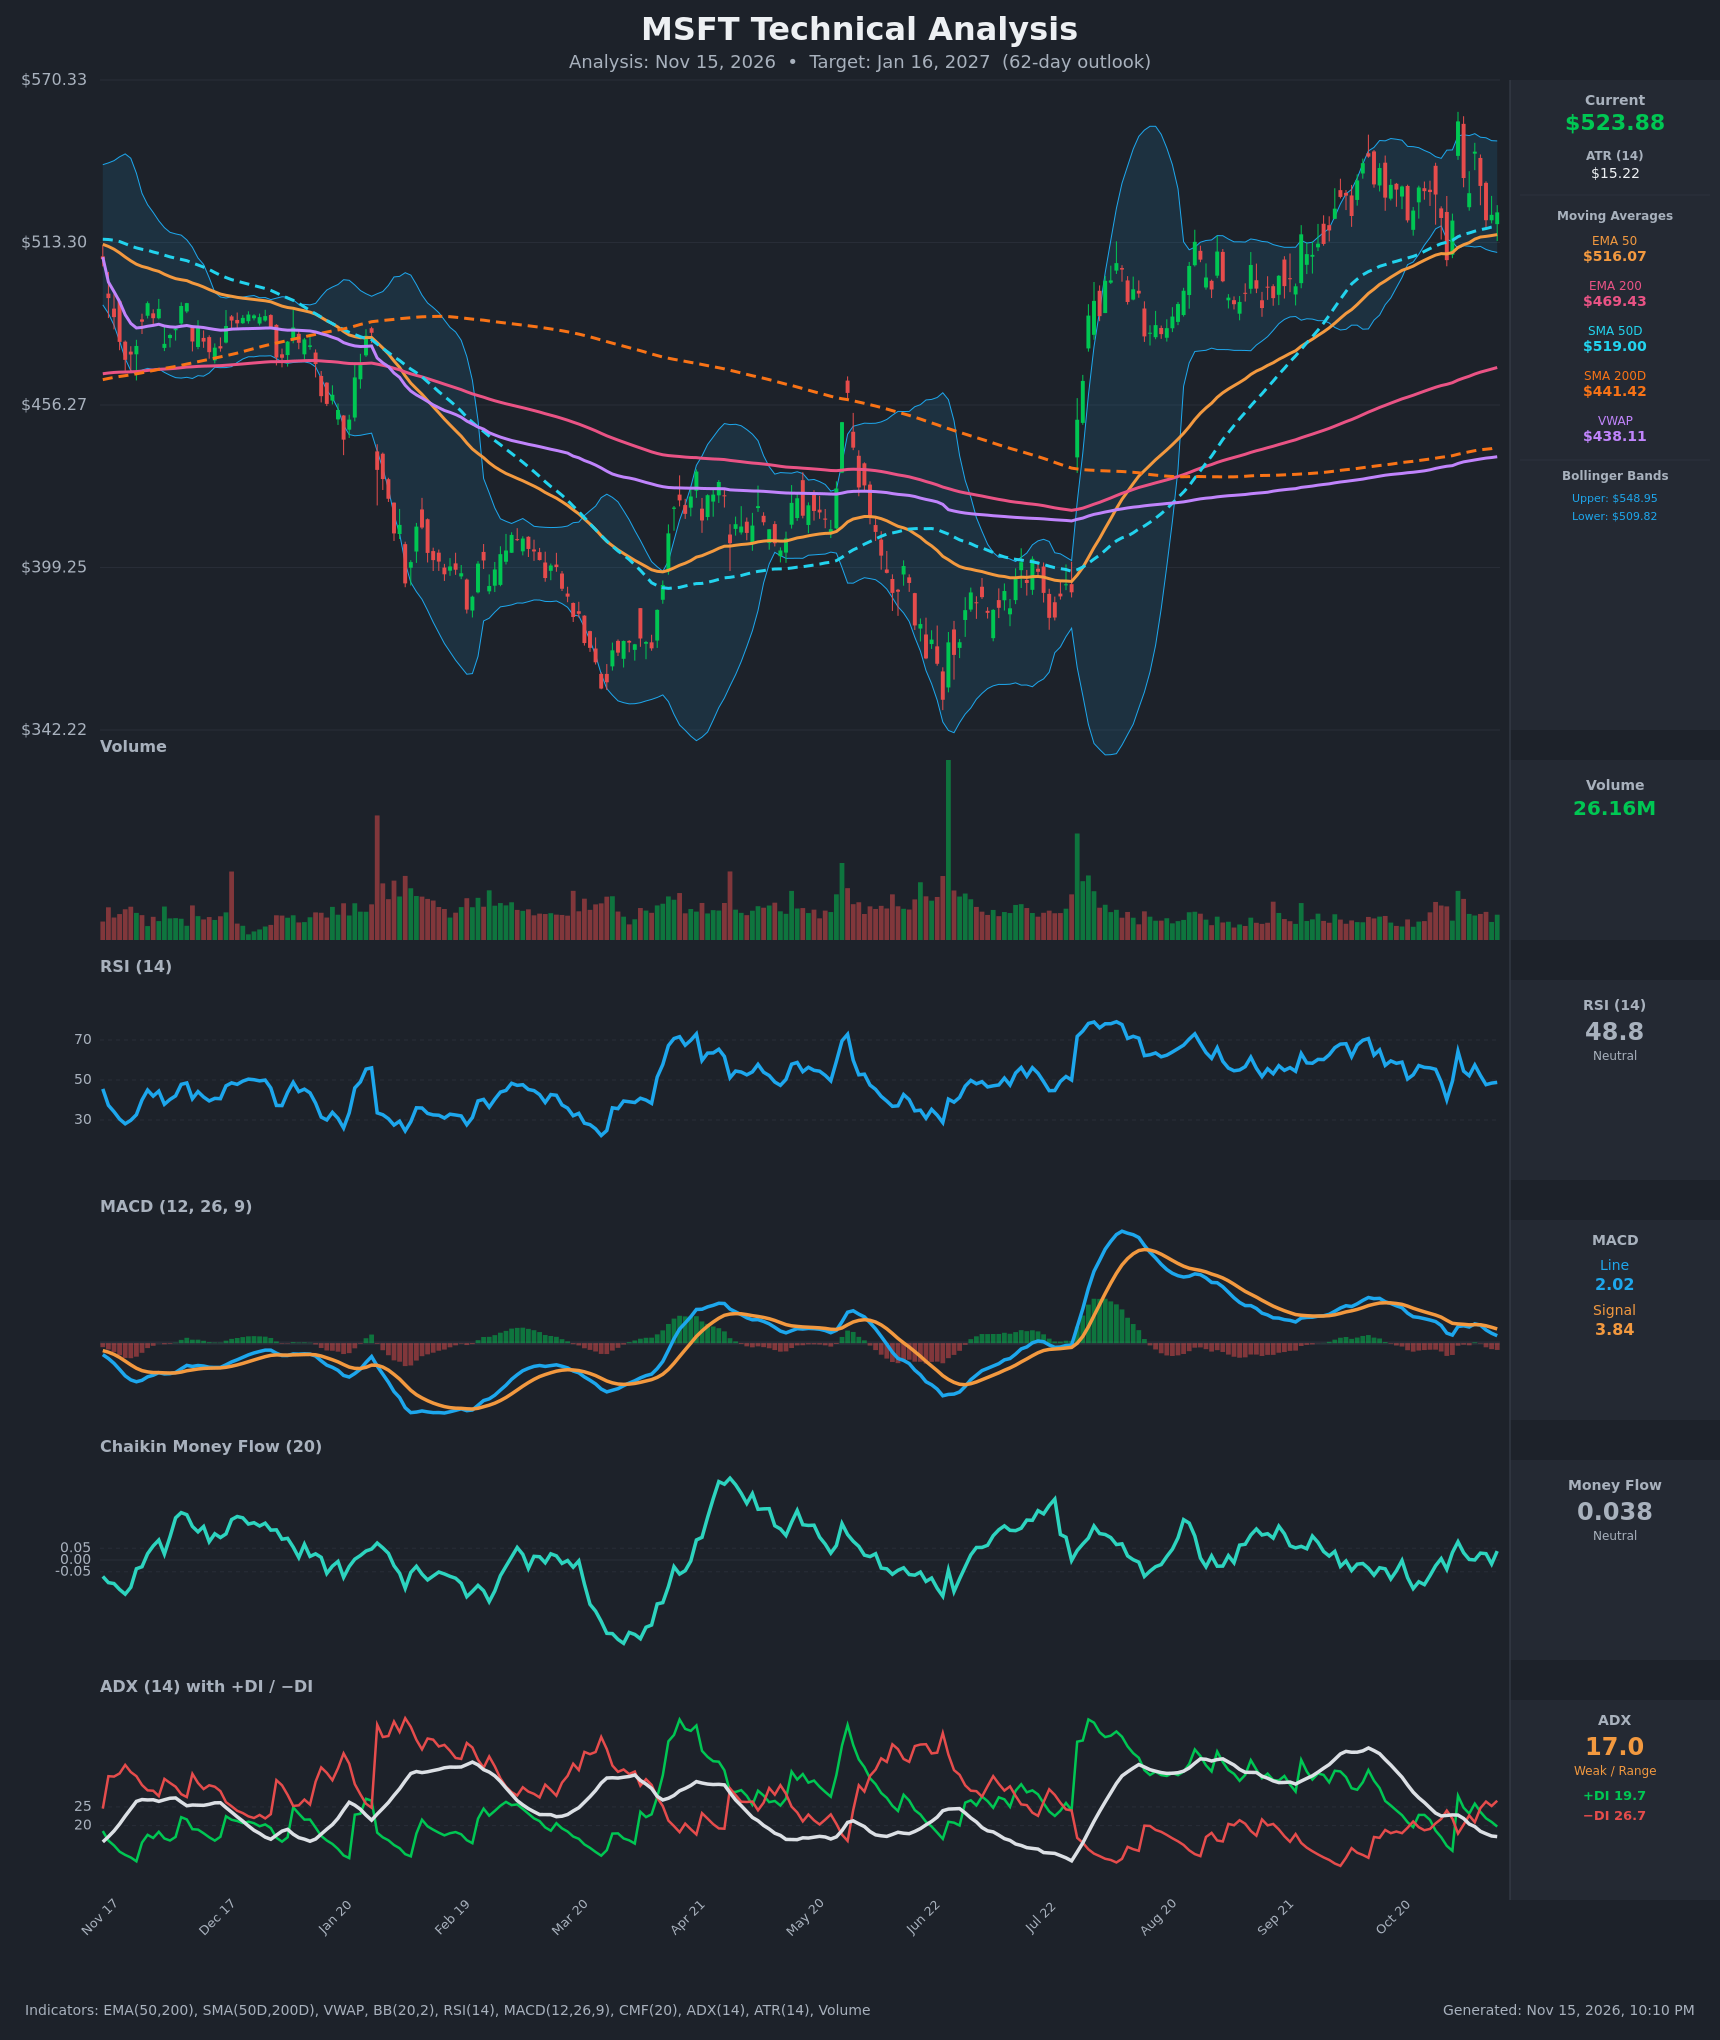
- RSI (14): 48.82, neutral and just under the 50 midline. It has cooled from 64.3 on Nov 4 and from 57.5 on Nov 9, and it is making lower highs. It is not oversold, so there is room to fall, but it is also not weak. [Neutral]
- 20 EMA: Not supplied. The EMA 50 ($516.07) and SMA 50D ($519.00) sit just below price, which makes the $516–519 zone the near-term support cluster. Price is only about $5 above it and has been coiling around it. [Neutral]
- MACD: The line (2.02) is below the signal (3.84) and the histogram is negative. The bearish crossover came around Oct 30 and the line has kept falling since, with only a brief stall on Nov 9. The line is still positive, so the longer-term trend is not broken. [Bearish]
- Bollinger Bands (20): The bands run $509.82 to $548.95, with the midline near $529.4. Price at $523.88 is in the lower half, about $14 above the lower band. The bands have narrowed from the early-November spike, which points to compression and a coming expansion. [Neutral]
- CMF (20): 0.038, between the ±0.05 thresholds. It has oscillated around zero for weeks, so there is neither accumulation nor distribution. [Neutral]
- ADX (14): 17.0 and falling from 27.4 on Oct 26, so the trend is weak and the market is range-bound. −DI (26.7) is above +DI (19.7), so sellers hold a slight edge, but the weak ADX makes that edge unreliable. [Weak Trend, slight bearish tilt]
- Volume: 26.16M is subdued and below the spikes seen at major turning points. The Nov 4 surge to $555.80 faded the next day and was not confirmed by sustained buying. The low-volume pullback suggests a lack of conviction in either direction. [Neutral]
Moving-average structure:
- Long-term trend: Price is above SMA200D ($441.42), EMA200 ($469.43) and VWAP ($438.11).
- Crossovers: EMA50 is above EMA200 and SMA50D is above SMA200D. The golden cross is already established and no death cross is anywhere near.
DIVERGENCES & TRENDS
- Momentum divergence: Price printed a near-equal high at about $555.80 on Nov 4, but RSI (64) and MACD (4.5) were far below their July peaks (RSI near 78, MACD above 10). This is a mild bearish momentum divergence versus the summer rally.
- Trend strength: ADX has fallen from the 30s to 17, so the Jul–Oct advance has lost directional force and shifted into consolidation.
- Crossovers and breaks: MACD crossed below its signal line, and −DI crossed back above +DI on Nov 10–13. Both are short-term bearish. The Oct 30 and Nov 2 dips to $507 held at the 50-day averages.
- Support holding: Price has repeatedly defended the $507–$521 zone, and EMA50 and SMA50 are still rising.
- Net read: Short-term momentum is soft inside a still-intact long-term uptrend.
CHART PATTERNS
- Bearish Double Top (possible): Highs near $556 in late October and on Nov 4 suggest a double top. The neckline is around $507–$510. A decisive close below it would project a measured move of about $48 (to roughly $460). This is not confirmed yet, because the neckline and the 50-day averages are still intact.
- Bullish continuation (flag/consolidation, alternative): After the strong Jul–Oct advance, the sideways drift between about $507 and $556 on low volume resembles a bullish flag or pennant continuation. A breakout above $556 would project roughly $590–$600.
- Assessment: The range is wide ($507–$556, about 9%). The uptrend, rising averages and support at the 50-day cluster slightly favor the continuation reading over the reversal reading.
POTENTIAL SCENARIOS
- Scenario 1: Bullish Range Resolution Higher — Price holds the EMA50/SMA50 cluster, MACD turns back up, and price retakes the Bollinger midline and then the highs near $556. Trigger: daily close above $530 followed by a break above $556 on rising volume. Target: $560–$590. Invalidation: daily close below $507. (45% probability)
- Scenario 2: Bearish Double-Top Breakdown — Weak ADX and −DI dominance give way to a confirmed breakdown through the neckline and the 50-day averages. Trigger: close below $507 with expanding volume. Target: $470–$485, with $460 as the measured move. Invalidation: reclaim of $530 on a closing basis. (30% probability)
- Scenario 3: Neutral Choppy Consolidation — Price continues to oscillate between about $507 and $556 with ADX below 20. Trigger: failure to break either boundary. Target: $510–$545. Invalidation: close outside the range. (25% probability)
PRICE TARGETS
Timeframe: 62 days, which falls in the 61–180 day bracket (18–30% range width).
- Target Price: $540.00
- Expected Range: $478.00 to $593.00 (width $115, about 22% of the current price)
- Key Levels: Support at $507.00, Resistance at $555.80
OVERALL BIAS
OVERALL BIAS: BULLISH - The long-term structure is intact: price is above all major averages, EMA50 is above EMA200, and the golden cross is in place. The pullback is holding the $507–$519 support cluster. Short-term MACD and −DI are soft and ADX is weak, so conviction is modest, but the bullish scenario carries the highest probability.
This is educational analysis and not financial advice.