MSFT 20-day bearish forecast — Nov 15, 2026
- Bias: Bearish
- Timeframe: 20 days (made Nov 15, 2026, target date Dec 4, 2026)
- Price at analysis: $523.88
- Price target: $514.00
- Expected range: $490.00 – $542.00
- Result: Pending — graded after the close on Dec 4, 2026
Get a free AI analysis of MSFT today
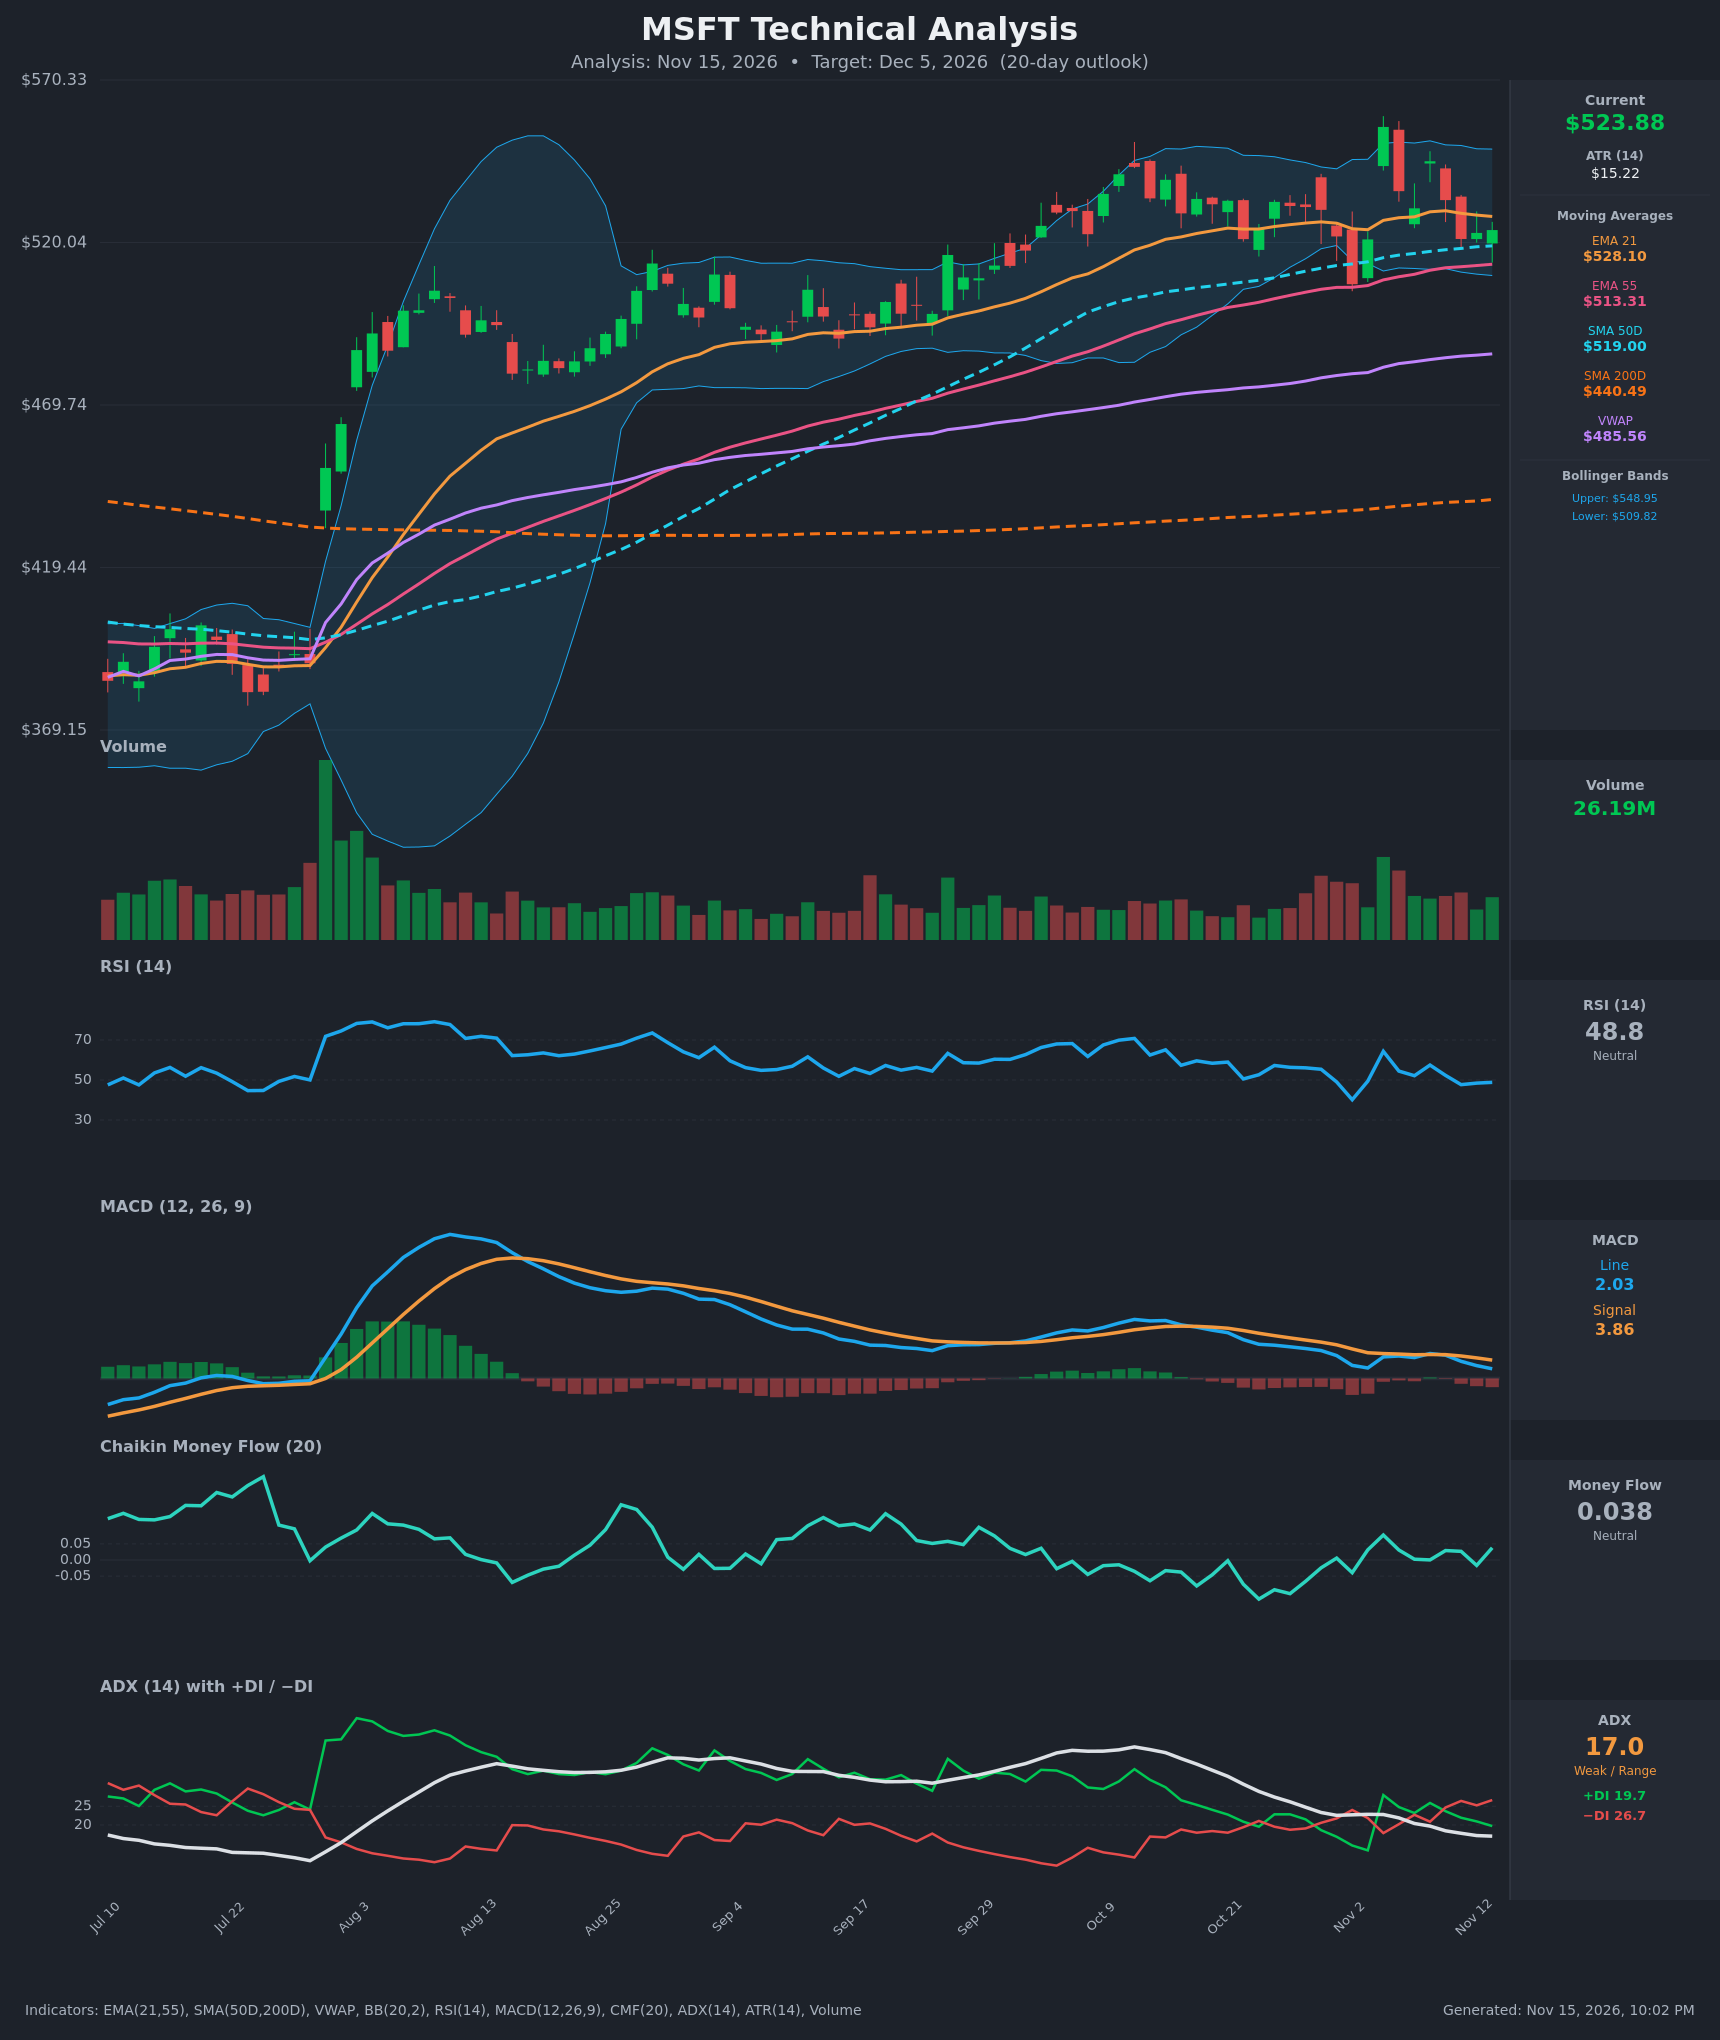
Analysis
TECHNICAL INDICATORS
- RSI (14): 48.82, just under the 50 midline. It has faded from 64.3 on Nov 4 and 57.5 on Nov 9, so momentum is rolling over but not oversold. [Neutral]
- 20 EMA (EMA 21): $528.10. Price at $523.88 is below it, and the EMA has been flattening and turning down since Nov 10. It is near-term resistance. EMA 21 remains above EMA 55 ($513.31), so there is no bearish crossover yet. [Bearish]
- MACD: Line 2.03 is below signal 3.86, and the histogram is negative (about -1.83) and widening. The line made a brief upward cross on Nov 9, then crossed back down on Nov 10 and has fallen for four straight bars. [Bearish]
- Bollinger Bands (20): Upper $548.95, lower $509.82, midline roughly $529.4. Price is below the midline in the lower half of the bands, and the bands are fairly narrow (about 7.4% wide). That points to range behavior with a slight downward lean toward the lower band and the 50-day/EMA 55 confluence. [Neutral]
- CMF (20): 0.038, between -0.05 and +0.05. It has oscillated around zero for a month with no sustained accumulation or distribution. [Neutral]
- ADX (14): 17.0 and falling from 27 in late October, so the trend is weak and range-bound. −DI (26.7) is above +DI (19.7), a modest bearish tilt that has held since Nov 10. [Weak Trend, bearish lean]
- Volume: 26.19M, average to slightly below average. The largest recent volume was on the Nov 4 spike to $555.80, which fully reversed within days. That is a failed breakout / exhaustion signature, and current volume shows no conviction either way. [Neutral to mildly bearish]
DIVERGENCES & TRENDS
- Mild bearish divergence: Price made a higher high in early November ($555.80), but RSI peaked at 64 versus about 70 in October, and MACD peaked far below its August high. Upside momentum is weakening.
- Long-term trend intact: Price is above SMA 50 ($519.00), EMA 55 ($513.31) and SMA 200 ($440.49). The golden cross (SMA 50 over SMA 200) is long established. Price sits about 7.9% above the VWAP of $485.56, so it is extended relative to the longer-term average cost.
- Short-term deterioration: The MACD bearish cross, −DI over +DI, and price under the EMA 21 all point to a pullback phase inside a larger uptrend.
- Compression: ADX is dropping below 20 and the daily swings are large (Nov 4 +6.7%, Nov 11 -2.2%). That suggests a choppy consolidation rather than a trend.
- Support stack below: SMA 50 at $519.00, EMA 55 at $513.31, the lower Bollinger Band at $509.82, and the Nov 2 low at $507.12. This cluster should slow any decline.
CHART PATTERNS
- Rectangle / consolidation: Price has traded roughly between $507 and $556 since late October, with ADX below 20. This is the dominant structure.
- Possible Bearish Double Top (not confirmed): The $555.80 high on Nov 4 and the lower $545.18 high on Nov 9 resemble a double top with a lower second peak. A confirmed break below the neckline at about $507 would project a measure of roughly $507 - ($555.80 - $507) ≈ $458. Confirmation is unlikely within 20 days, but it caps the upside in the meantime.
- Bullish case from the diagram: Higher lows ($507 → $521 → $521) against flat highs hint at an Ascending Triangle. A close above about $546–556 would project toward $580+. Price is not there yet.
POTENTIAL SCENARIOS
- Scenario 1: Bearish Pullback to Support Cluster — Price rejects the falling EMA 21 and drifts lower on a negative MACD and −DI dominance, testing the SMA 50 / EMA 55 / lower Bollinger zone. Trigger: close below $519 (SMA 50). Target: $509–$514, with an extension to $500 if $507 breaks. Invalidation: daily close above $529 (EMA 21) with MACD turning up. (40% probability)
- Scenario 2: Neutral Range Chop — Price oscillates between $510 and $540 with weak ADX and no sustained volume. Trigger: holds $509–$513 and fails at $535–$545. Target: $515–$530. Invalidation: close outside $507–$556. (33% probability)
- Scenario 3: Bullish Reclaim and Breakout — Buyers defend the EMA 55/SMA 50, MACD re-crosses up, and price retakes the EMA 21 and pushes to the upper band. Trigger: close above $529 and then $546. Target: $545–$556, with a break of $556 opening $570. Invalidation: close below $507. (27% probability)
PRICE TARGETS
- Target Price: $514.00 (20-day horizon, about -1.9% from the current price)
- Expected Range: $490.00 to $542.00. The width is $52, about 9.9% of the current price, which fits the 14–21 day guidance of 8–12% and is wider than a 2–3 day range.
- Key Levels: Support at $513.31 (EMA 55, with SMA 50 at $519 and the lower Bollinger Band at $509.82 nearby), Resistance at $528.10 (EMA 21, with $548.95 upper band and $555.80 high above).
OVERALL BIAS
OVERALL BIAS: BEARISH - Price is below the declining EMA 21, MACD is below its signal with a widening negative histogram, −DI leads +DI, and RSI/MACD show weakening momentum against the failed Nov 4 spike. The long-term uptrend and the dense support at $509–$519 should limit the decline to a pullback.
This is educational analysis and not financial advice.