MSFT 34-day bearish forecast — Nov 15, 2026
- Bias: Bearish
- Timeframe: 34 days (made Nov 15, 2026, target date Dec 18, 2026)
- Price at analysis: $523.88
- Price target: $512.00
- Expected range: $478.00 – $553.00
- Result: Pending — graded after the close on Dec 18, 2026
Get a free AI analysis of MSFT today
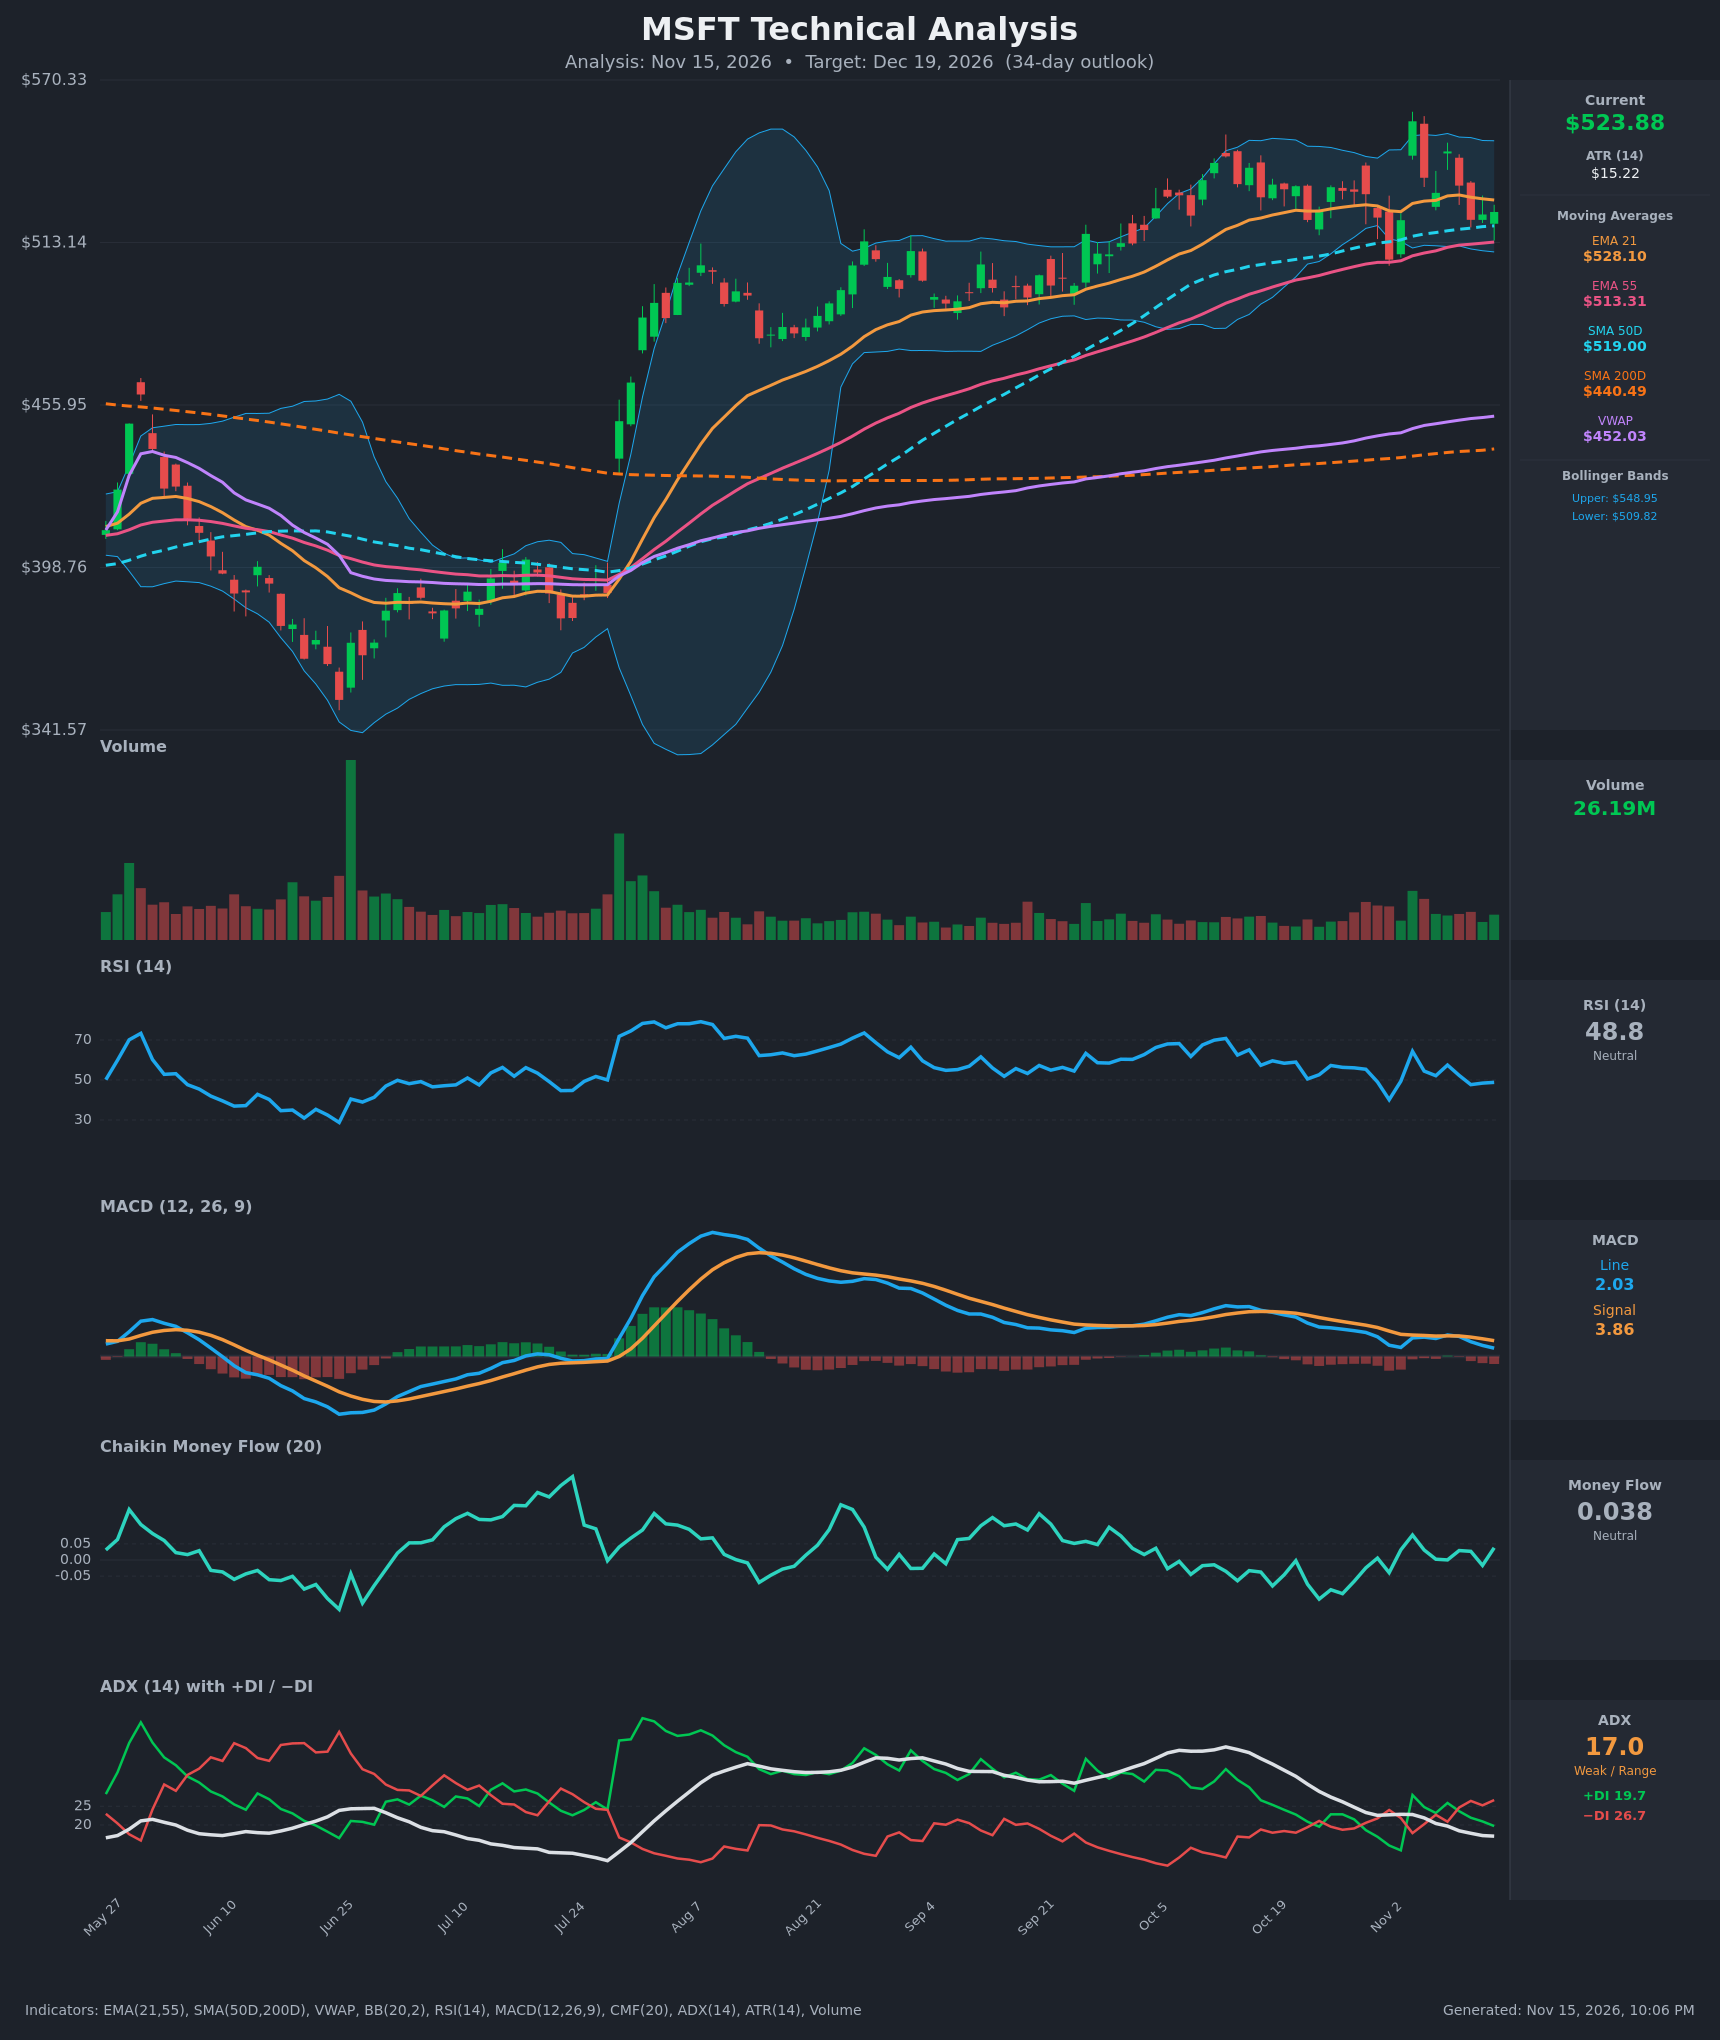
Analysis
TECHNICAL INDICATORS
- RSI (14): 48.82, neutral and just below the midline. It has made lower highs (64.3 on Nov 4, 57.5 on Nov 9, 48.8 now), so momentum is fading, though it is not oversold. [Neutral]
- 20 EMA (EMA 21): $528.10, with price at $523.88 just below it. The EMA is rolling over from its Nov 10 peak of $529.87 and now acts as near-term resistance. EMA21 is still above EMA55 ($513.31), so the medium-term structure is intact. [Bearish]
- MACD: Line 2.03 is below Signal 3.86, and the histogram is about −1.83. The bearish cross happened around Nov 10-11 and the gap is widening. Both lines are still above zero, so the larger uptrend is only cooling, not reversing. [Bearish]
- Bollinger Bands (20): Upper $548.95, lower $509.82, midline about $529.4. Price is in the lower half of the bands, below the midline. The bands have been fairly flat, so volatility is moderate. The Nov 4 spike to $555.80 pierced the upper band and was rejected. [Neutral]
- CMF (20): 0.038, between the ±0.05 thresholds. It oscillates around zero with no sustained accumulation. [Neutral]
- ADX (14): 17.0 and falling from 27 on Oct 26, so the trend is weak. −DI (26.7) is above +DI (19.7), and the −DI lead has widened since Nov 10, so sellers have a slight edge in a non-trending market. [Weak Trend, Bearish lean]
- Volume: 26.19M, average to slightly below average. There were no heavy-volume breakouts in the last few weeks, and the Nov 4 spike reversed quickly. This suggests low conviction on both sides. [Neutral]
DIVERGENCES & TRENDS
- RSI lower highs: RSI peaked at 64 and then 57.5 while price stayed near the highs ($555 and $545). That is mild bearish divergence.
- MACD: The Nov 10-11 bearish cross, with the histogram expanding negative, shows momentum rolling over.
- ADX: It has dropped from 27 to 17. The Oct trend has lost strength and the market is in consolidation.
- Moving averages: Price is above SMA200D ($440.49), EMA55 and SMA50D ($519.00), so the long-term uptrend is intact. The SMA50D is also acting as a support cluster with EMA55 and the lower band at $510-519. There is no recent golden or death cross, and the 50D is far above the 200D.
- VWAP: Price is well above the anchored VWAP ($452.03). This confirms the long-term bullish trend, but the move is stretched.
- Price action: The Nov 4 spike to $555.80 was a blow-off reversal, followed by a lower high at $545.18 and a close back below the EMA21.
CHART PATTERNS
- Bearish double-top / rounded-top tendency: The rejection at $555.80 and the lower high at $545 form a possible double top, with neckline support around $507-510 (the Nov 2 low and the lower Bollinger Band). The pattern is not confirmed until $507 breaks on a close. If it does, the measured move is about $48 lower, to roughly $459, which is beyond this timeframe.
- Consolidation range: Price has held between about $507 and $556 since early October. This is the same range the weak ADX describes.
- Bullish backdrop: The longer-term pattern is a steady uptrend since the late-July breakout, so any pullback is likely to find support at the SMA50D/EMA55 zone.
POTENTIAL SCENARIOS
- Scenario 1: Bearish Pullback to Support Cluster — Negative MACD, −DI dominance and rejection at the EMA21 and the highs drive a drift lower toward the EMA55/SMA50D/lower-band zone, with a possible test of $507. Trigger: close below $513 with MACD histogram staying negative. Target: $505-$512, with an extension to about $490 if $507 fails. Invalidation: daily close above $529-$530 (EMA21 and the Bollinger midline) with MACD re-crossing up. (45% probability)
- Scenario 2: Neutral Range Consolidation — Weak ADX keeps price oscillating between $507 and $545, and the end price lands near the current level. Trigger: holds above $507 and fails to clear $545. Target: $515-$535. Invalidation: close outside the $505-$548 range. (30% probability)
- Scenario 3: Bullish Breakout Continuation — Buyers defend the SMA50D/EMA55 area, MACD turns back up, and price retakes the EMA21 and pushes to new highs. Trigger: close above $530, then above $545 on rising volume. Target: $555-$570. Invalidation: close back below $513. (25% probability)
PRICE TARGETS
For the 34-day horizon (to about Dec 19, 2026):
- Target Price: $512.00 (about −2.3% from current)
- Expected Range: $478.00 to $553.00 (width $75, about 14.3% of current price, in line with the 12-18% guidance for 30-60 days)
- Key Levels: Support at $507.12 (Nov 2 closing low, with the $509.82 lower Bollinger Band and $513.31 EMA55 just above it), Resistance at $545.18 (the Nov 9 lower high, with the $528.10 EMA21 as the first hurdle)
OVERALL BIAS
OVERALL BIAS: BEARISH - MACD has crossed below its signal with a widening negative histogram, −DI leads +DI, RSI is making lower highs, and price is below the EMA21 after rejection at $555. The longer-term uptrend and the SMA50D/EMA55 support cluster should limit the downside, so conviction is modest and a pullback toward about $512 is the base case.
This is educational analysis and not financial advice.