MSFT 83-day bullish forecast — Nov 15, 2026
- Bias: Bullish
- Timeframe: 83 days (made Nov 15, 2026, target date Feb 5, 2027)
- Price at analysis: $523.88
- Price target: $545.00
- Expected range: $480.00 – $595.00
- Result: Pending — graded after the close on Feb 5, 2027
Get a free AI analysis of MSFT today
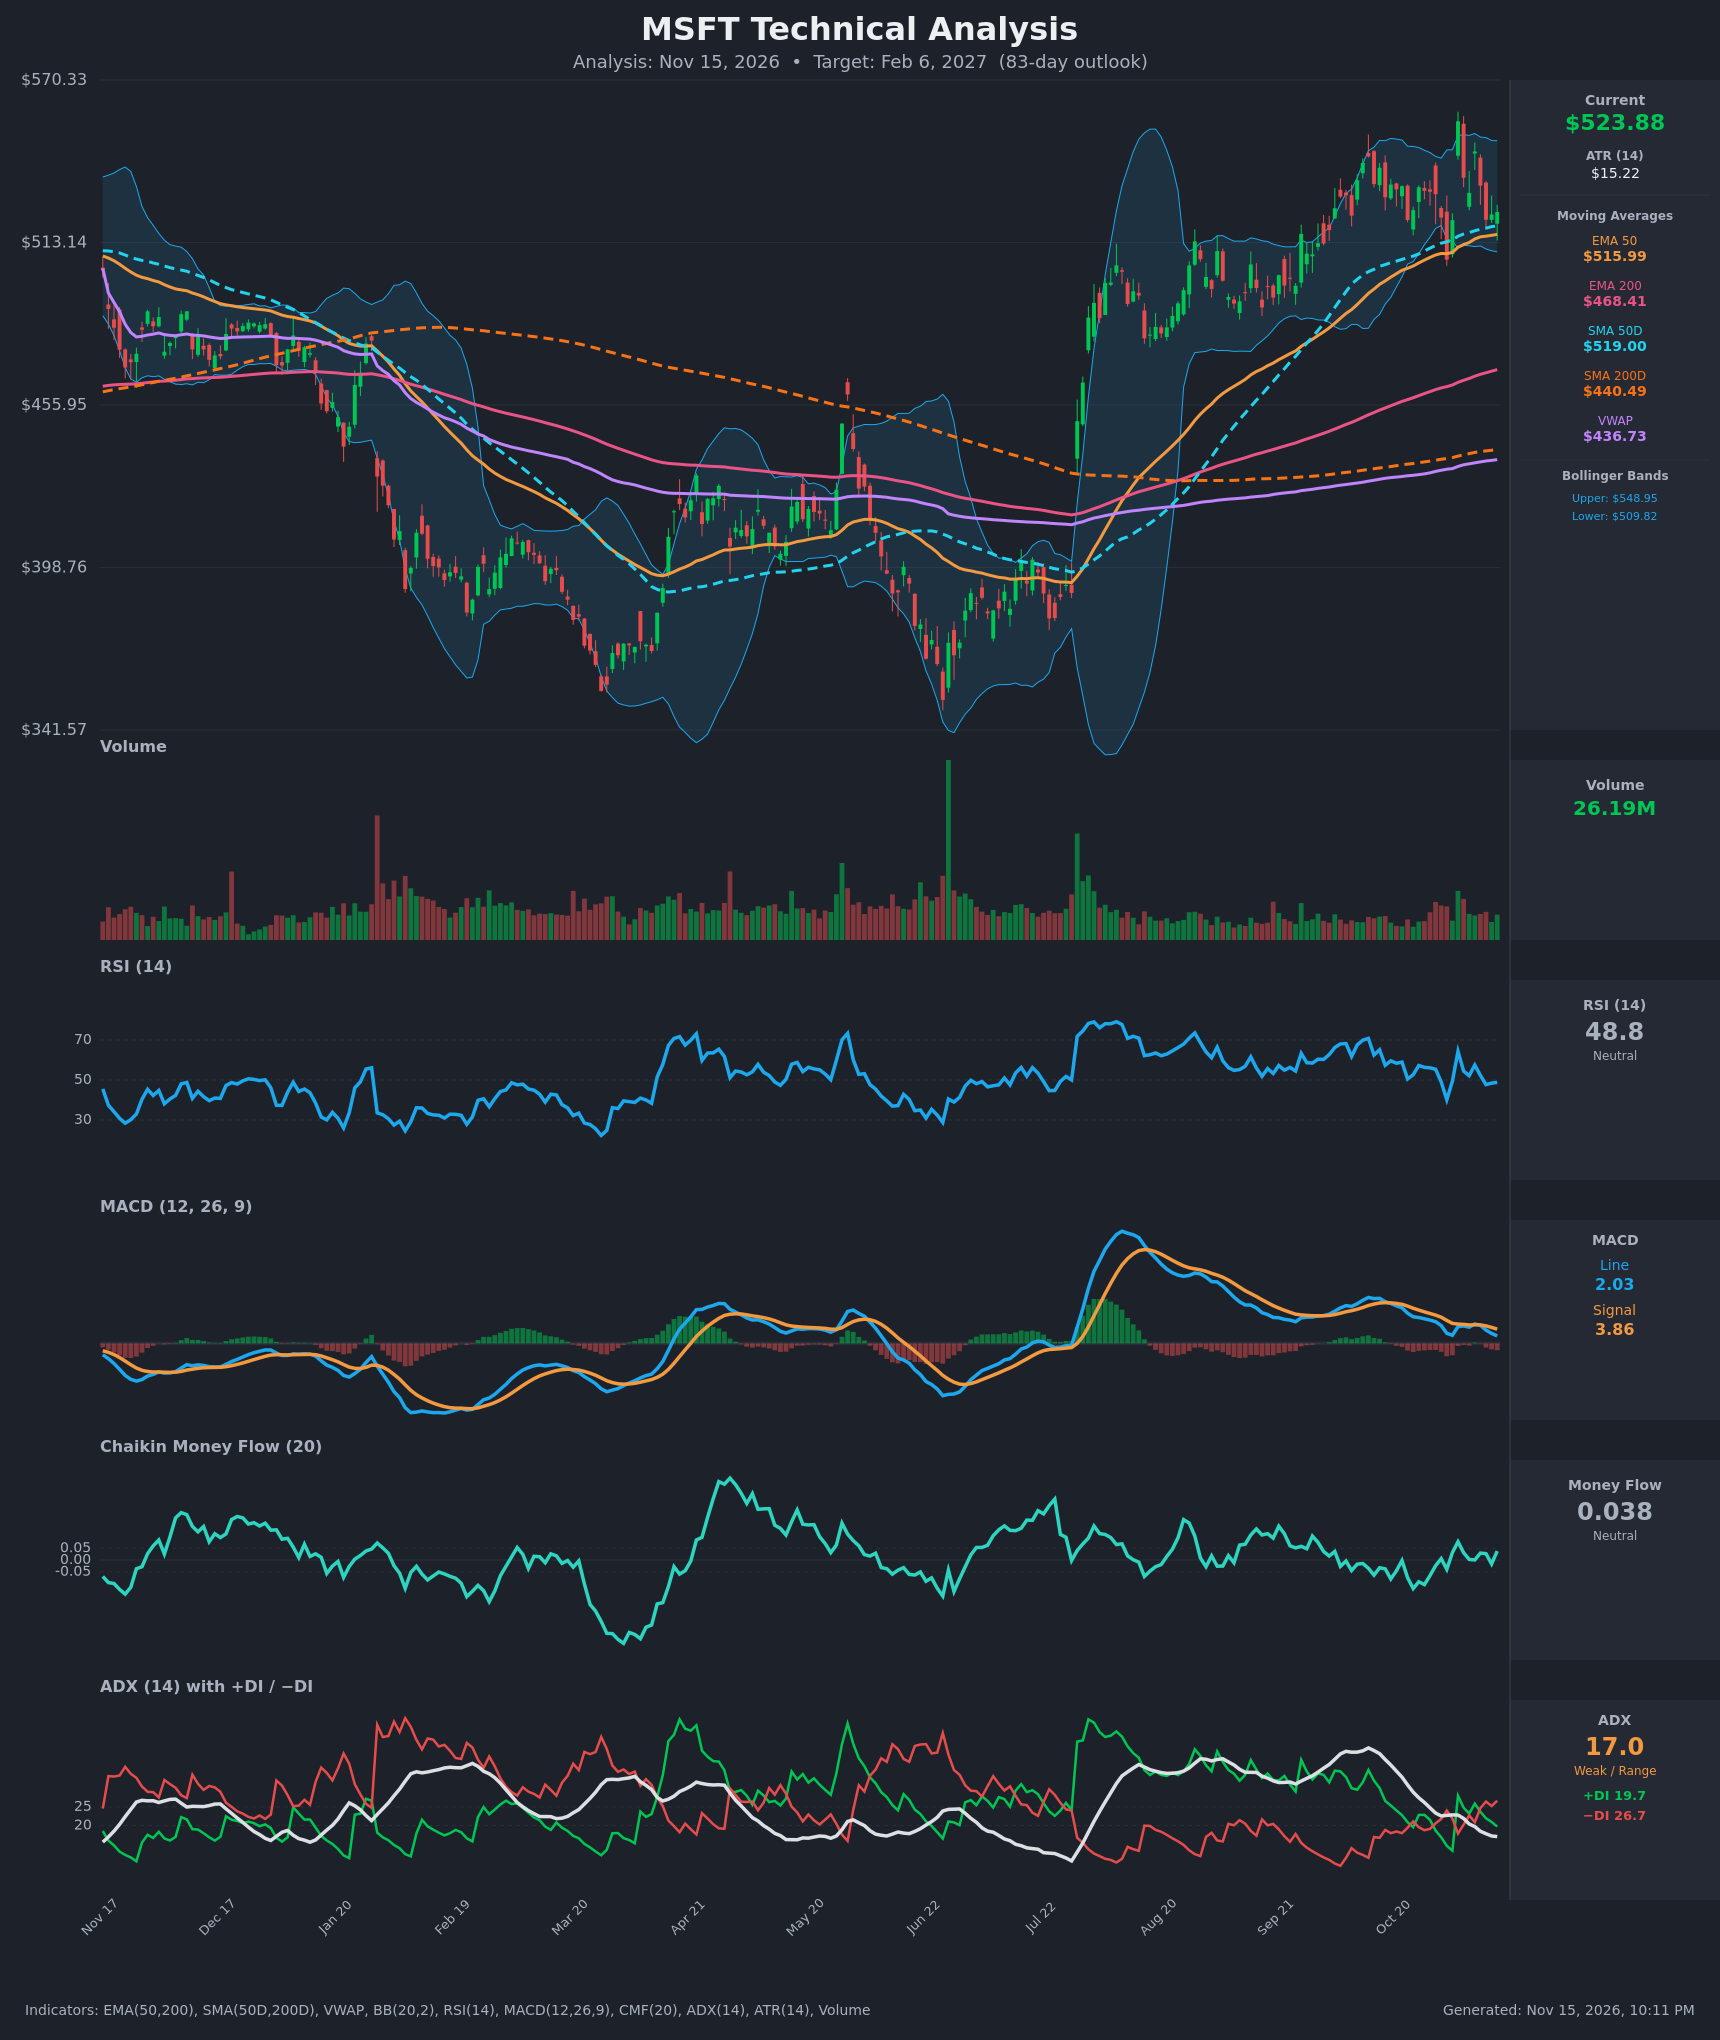
Analysis
TECHNICAL INDICATORS
- RSI (14): 48.82, just under the 50 midline. It has swung between 40 and 64 over the last two weeks without reaching overbought or oversold, and has drifted lower since the Nov 9 reading of 57.5. Momentum is flat to slightly soft. [Neutral]
- 20 EMA: The chart shows no 20 EMA, so I use the EMA 50 at $515.99 and the SMA 50 at $519.00 as the nearest dynamic support. Price at $523.88 sits just above both, only about 1% over the SMA 50. The EMA 50 is still rising, and EMA 50 is well above EMA 200 ($468.41), so the trend structure is intact. [Bullish]
- MACD: The line is at 2.03 and the signal at 3.86, so the line is below the signal. The bearish crossover occurred around Oct 29 and has persisted. The histogram is slightly negative at about -1.8. The line is still positive but fading from a peak of about 7. [Bearish]
- Bollinger Bands (20): The bands are $509.82 to $548.95, with the midline near $529.4. Price is below the midline in the lower half of the bands. Bandwidth is moderate and contracting from the Nov 4 spike. A test of the lower band near $510 is possible, and it lines up with the EMA 50. [Neutral]
- CMF (20): 0.038, inside the ±0.05 neutral zone. It has hovered around zero for most of the last two weeks, after being negative in late October. There is no clear accumulation or distribution. [Neutral]
- ADX (14): 17.0, below 20, and falling from 27.4 in late October. −DI (26.7) is above +DI (19.7), so sellers are slightly in control, but the weak ADX shows there is no real trend and the market is range-bound. [Weak Trend, Bearish lean]
- Volume: 26.19M, which looks average to below average compared with the volume bars on the chart. There was no heavy distribution volume on the recent pullbacks. The Nov 4 spike to $555.80 reversed quickly, which suggests supply near the highs. [Neutral]
DIVERGENCES & TRENDS
- MACD and price: Price is holding in the $520s, close to its recent high zone, while MACD has made lower highs and crossed below its signal. This is mild bearish momentum divergence, a loss of upside thrust rather than a reversal signal.
- RSI: The RSI peaks over the last month were 57 to 64, lower than the strong readings from the summer rally. Momentum has been fading since the rally.
- Long-term structure: Price is above both the SMA 200 ($440.49) and EMA 200. The EMA 50 and SMA 50 are rising, and the golden cross (SMA 50 above SMA 200) is already in place. The long-term uptrend is firmly intact.
- DI crossover: −DI crossed above +DI on about Nov 10 to 11. ADX is below 20 and falling, so this is a weak signal with limited follow-through.
- VWAP: Price is far above VWAP ($436.73), which shows the broader rally has strong buyer participation.
- Near-term range: Price has traded between about $507 and $556 for three weeks. The Nov 4 spike to $555.80 was sold quickly, and price is now back near the middle of the range.
CHART PATTERNS
- Symmetrical triangle / range consolidation: After the strong July to October advance, price is consolidating in a $507–$556 range with contracting volatility and weak ADX. In the reference diagram this looks like a continuation structure. The measured-move implication of a breakout above $556 is roughly $590–$600.
- Possible double top: Highs near $555 (Nov 4) and the early-November peaks form a potential bearish double top or failed breakout. It is only confirmed on a close below the neckline near $507–$510 (the lower band and recent swing low). A confirmed break would project a drop of about $45–$50 toward $460–$465, near the EMA 200.
- Trend context favors continuation over reversal while price holds above the 50-day averages.
POTENTIAL SCENARIOS
- Scenario 1: Bullish Range Breakout and Trend Continuation — Price holds the EMA 50/SMA 50 zone, the MACD re-crosses upward, and the range resolves to the upside in line with the long-term uptrend. Trigger: daily close above $556 on rising volume, or a MACD bullish crossover with RSI above 55. Target: $545 by the 83-day mark, with an extension toward $590–$600. Invalidation: daily close below $507. (45% probability)
- Scenario 2: Bearish Double-Top Breakdown — Fading momentum, −DI dominance and the failed spike at $555.80 lead to a break of the range floor and a move toward the long-term averages. Trigger: close below $507–$510 (lower band and swing low). Target: $470–$480 (EMA 200 area). Invalidation: close back above $540. (35% probability)
- Scenario 3: Neutral Extended Range — Weak ADX persists and price chops between roughly $505 and $556 for the whole period. Trigger: repeated failures at both range edges, with ADX staying below 20. Target: $515–$535. Invalidation: any decisive close outside $505–$556. (20% probability)
PRICE TARGETS
- Target Price: $545.00 (83-day horizon)
- Expected Range: $480.00 to $595.00 (width $115, about 22% of the current price, consistent with the 61–180 day guidance of 18–30%)
- Key Levels: Support at $516.00 (EMA 50, with the SMA 50 at $519 and the lower band at $509.82 just below), Resistance at $555.80 (Nov 4 high, near the upper Bollinger Band at $548.95)
OVERALL BIAS
OVERALL BIAS: BULLISH - Price is above the rising 50- and 200-day averages in an established long-term uptrend, and the consolidation near the highs is more consistent with continuation than reversal. Short-term MACD and DI weakness is real, so conviction is modest, and a close below $507 would shift the odds toward the bearish scenario.
This is educational analysis and not financial advice.